Operating the Instrument
R&S
®
RTP
40Getting Started 1337.9946.02 ─ 05
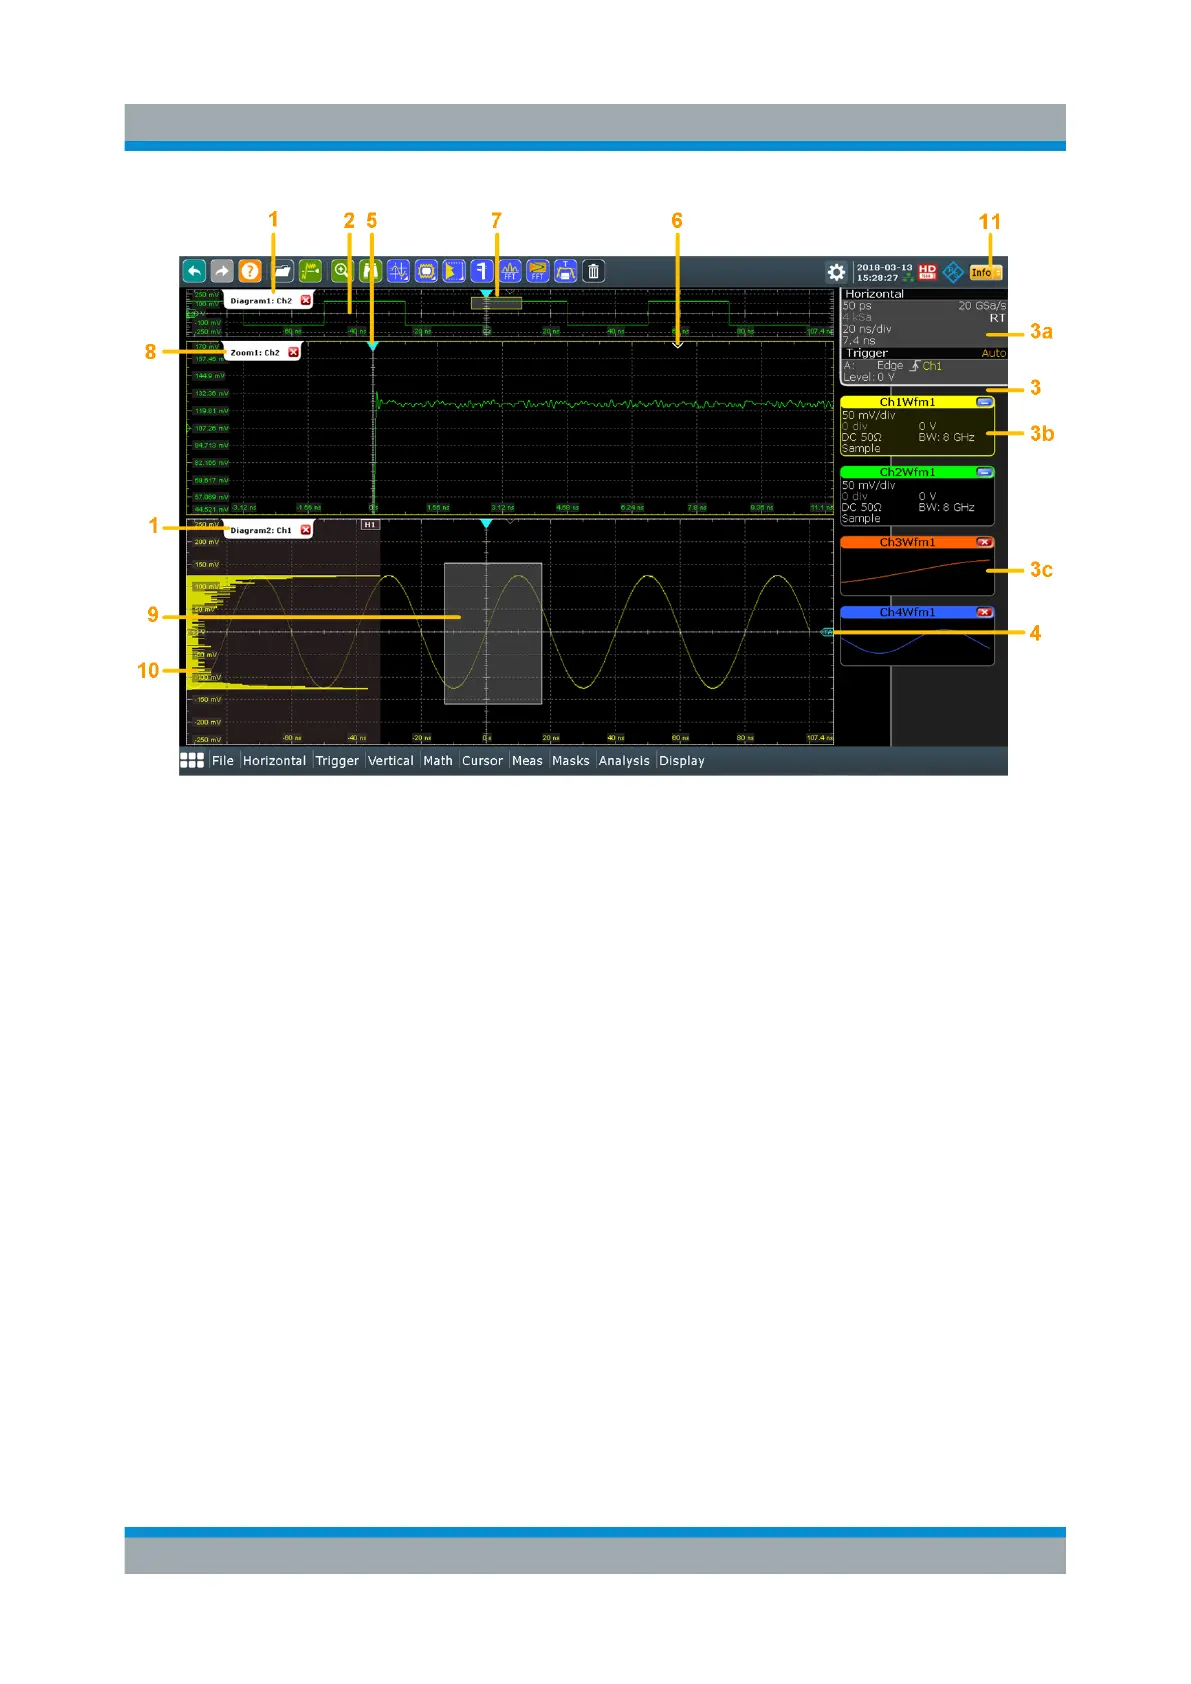
Figure 5-1: Display information
1 = Diagram
2 = Grid
3 = Sidebar with horizontal and trigger label (3a), signal icon with waveform settings (3b) and
signal icon with minimized live waveform (3c)
4 = Trigger level
5 = Trigger position
6 = Reference point (distance from trigger position to reference point = horizontal position)
7 = Zoom area
8 = Zoom diagram
9 = Histogram area
10 = Histogram
11 = Messages
Diagram (1)
A diagram shows one or more waveforms: channel, reference, and math wave-
forms together with histograms, masks etc. Zoom details, XY-waveforms, spectra
and other special waveforms are shown in separate diagrams.
By default, the diagram name contains the diagram number and the short names
of the waveforms shown inside. To change the diagram name, touch and hold the
tab name. The on-screen keyboard opens to enter the new name. Names must
be unique.
Touchscreen Display

 Loading...


