8 ECG Recording Analysis
8.2 Resting ECG Recordings
Page 94
Art. no.: 2.511335 Rev. a
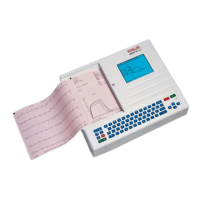
CARDIOVIT CS-104
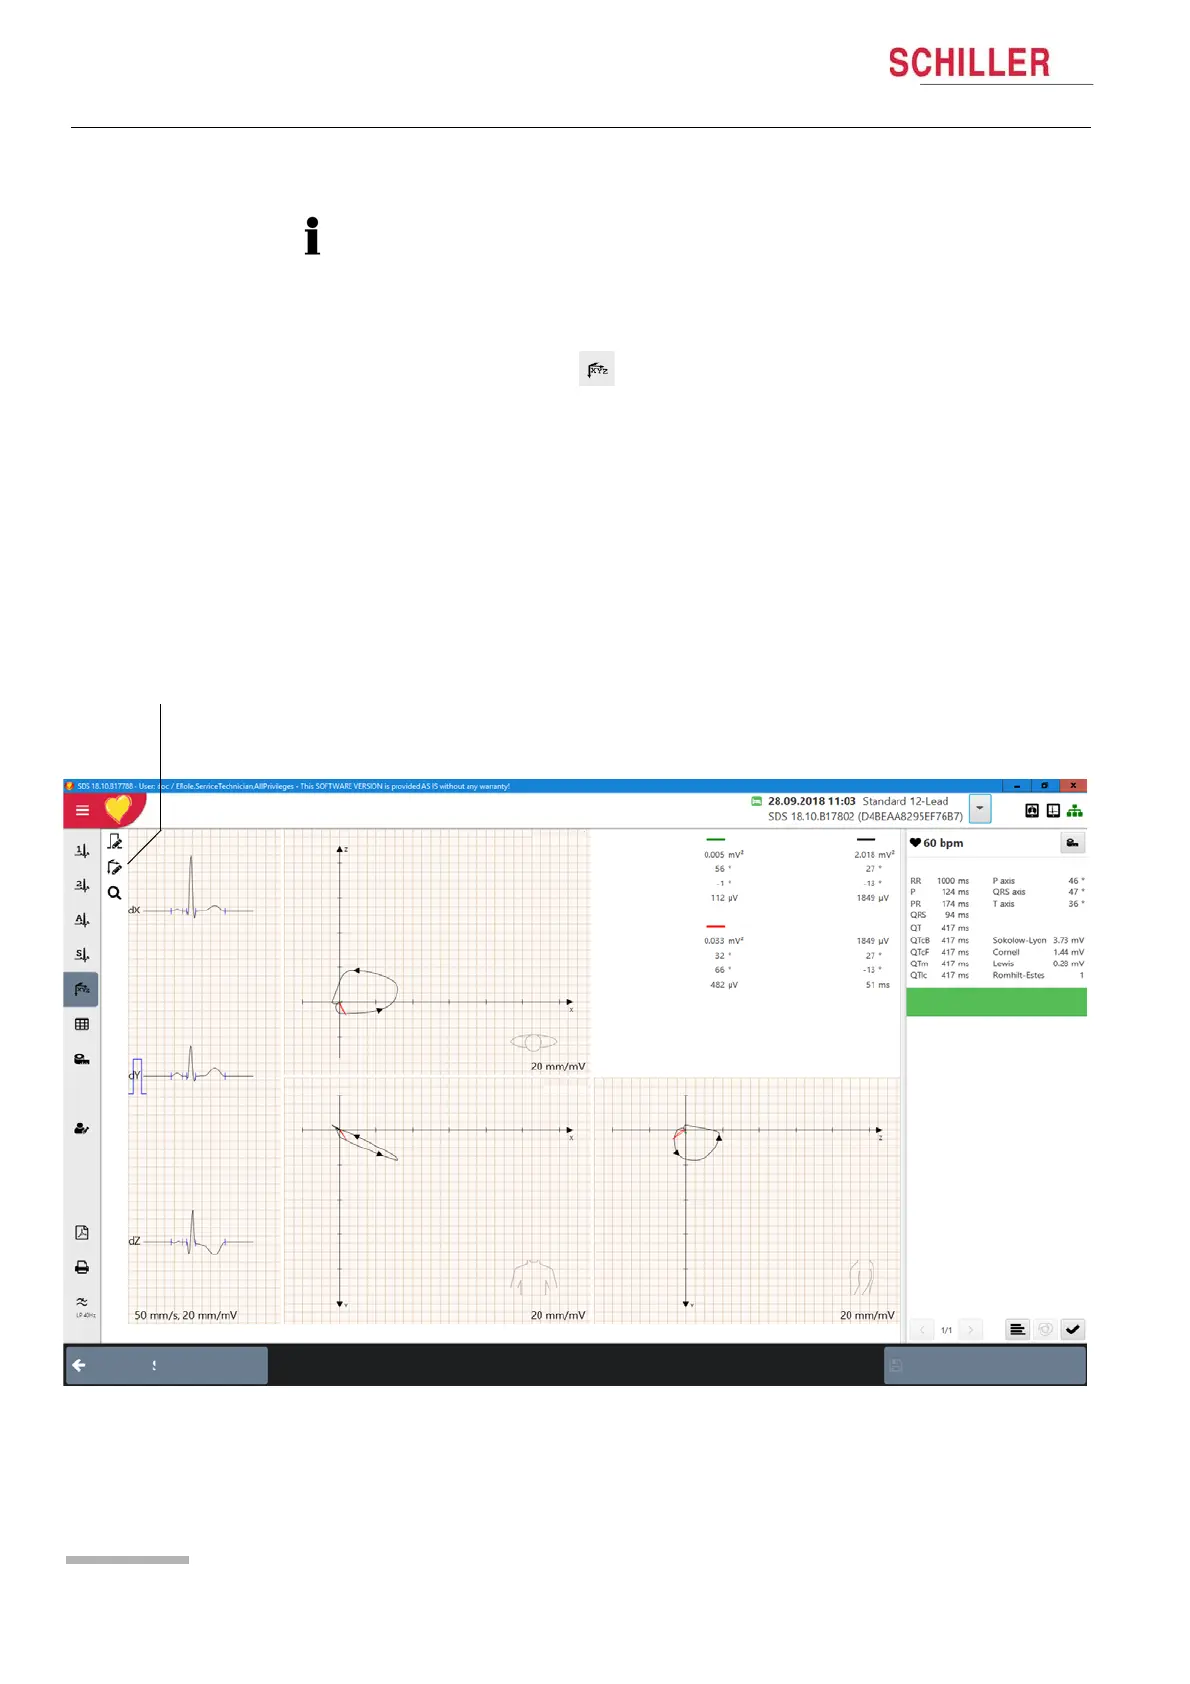
8.2.14 Vector Cardiogram
Vector cardiograms and measurements can be displayed when leads Frank, or
standard + X, Y, Z have been taken on the original recording.
With the vector option, X, Y, Z leads can be calculated to enable vector cardiograms
to be generated from a standard 12 lead recording.
Select Vector ECG .
A vector cardiogram traces the direction and magnitude of the heart's
electrical
activity during a cardiac cycle. It is produced from the three orthogonal leads X, Y, Z.
The size (magnitude) and the direction of a vector are indicated by three spatial
coordinates (X, Y and Z). The shape, the direction of the rotation, the orientation and
the speed of rotation of the individual loops are the predominant factors for the
analysis of the vector cardiogram. Vector loops are represented spatially and
projected on the following three planes:
• Horizontal plane (X, Z)
• Frontal plane (X, Y)
• Sagittal plane (Z, Y)
The P wave, QRS and T loops can be
displayed in any combination
Search
Save
Intervals
Axes
Created by ETM V1.13.0.0
T-Loop
Maximum Vector
P-Loop
QRS-Loop
Area
Elevation
Azimuth
Max Vector
Area
Elevation
Azimuth
Max Vector
Area
Elevation
Azimuth
Max Vector
Vector
Elevation
Azimuth
TI Index
Horizontal
Frontal
Left sagittal
12-34-55 | 19.04.17
Fred Smith | 38 years | Male
LVH Criteria
Sinus rhythm
Normal electrical axis
Normal ECG
 Loading...