8
This document is the property of SDMO Industries.
Any communication, reproduction, publication, even partial, is forbidden, except with the written authorisation of the owner.
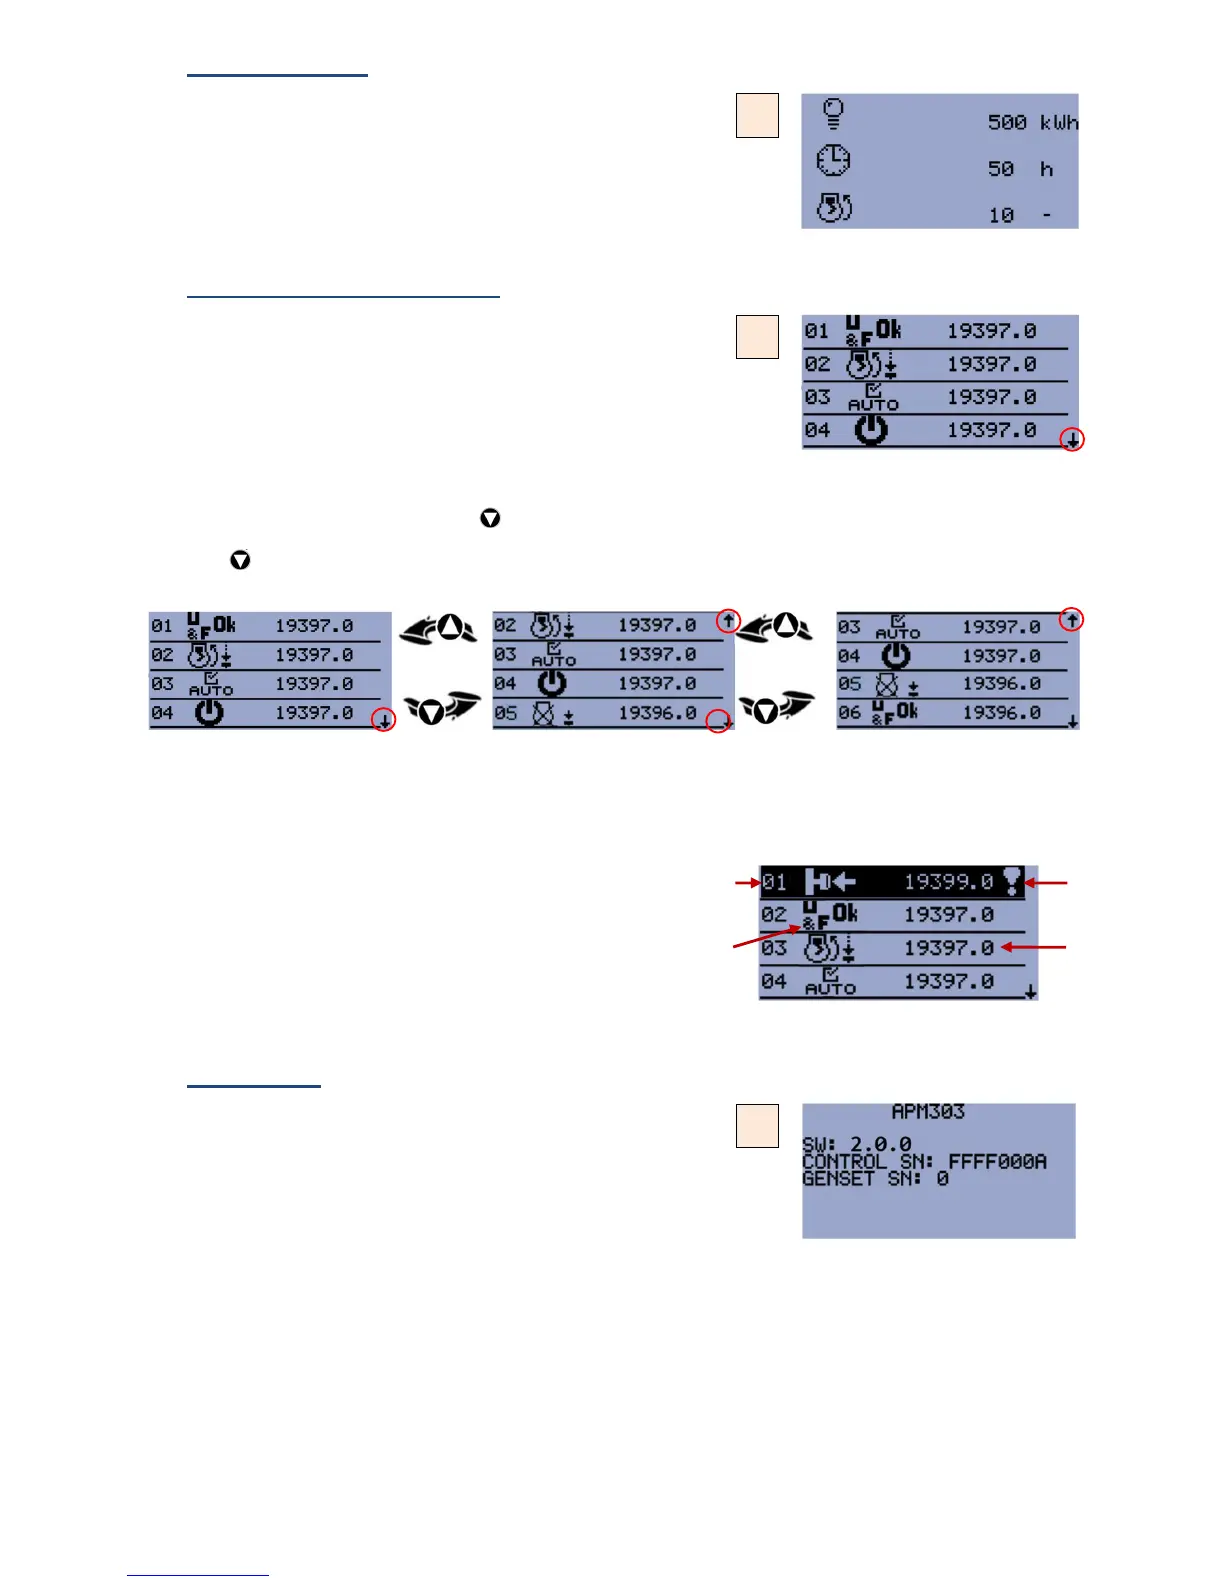
6.4 Metering, screen 5
The following information is displayed on screen
:
active energy in kWh (e.g.: 500kWh).
the number of operational hours of the generating set (e.g.: 50h),
the number of generating set start-ups (e.g.: 10).
Figure 8 - meters
6.5 Events and anomalies, screen 6
Screen
shows the list of events and anomalies recorded by the
.
A maximum of 12 events and anomalies can be recorded (the last 4 appear
on screen).
Consequently, when a new event or anomaly is recorded, the oldest event
or anomaly is deleted from the stack.
Figure 9 - events and anomalies
When scrolling (manually or automatically), the symbol
appears at the bottom of the screen (flashing) for 4 seconds.
When the symbol is fixed, pressing button enables you to go down the stack of events and anomalies according to the
following principle.
When the button is first pressed, the
, symbol appears to show that there are more recent events or anomalies on this
screen.
screen for lines 1, 2, 3 & 4
screen for lines 2, 3, 4 & 5
screen for lines 3, 4, 5 & 6
Figure 10 - navigating through the stack
You can continue navigating in this way, until the screen for lines 9, 10, 11 & 12 is displayed.
Information available on these screens:
the event or anomaly appears in numerical order (01 to 12)
Figure 11 - information available on
screen 6
pictogram representing the event or anomaly (see lists in section ‘Events
and anomalies’)
anomaly status (4 different statuses) (see section ‘Clearing a fault’)
number of hours generating set has been operating when event or
anomaly appeared
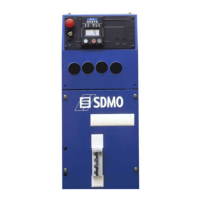
6.6 INIT, screen 0
Screen
displays the main identification parameters:
the software number,
the serial number of the APM303 module,
the generating set serial number.
Figure 12 - INIT
CALL US TODAY
1-888-POWER-58
REQUEST A QUOTE
parts@genpowerusa.com
SHOP ONLINE
www.genpowerusa.com