METIS M311 / M322 / H311 / H322 (17-pin)
SensorTools Software
28
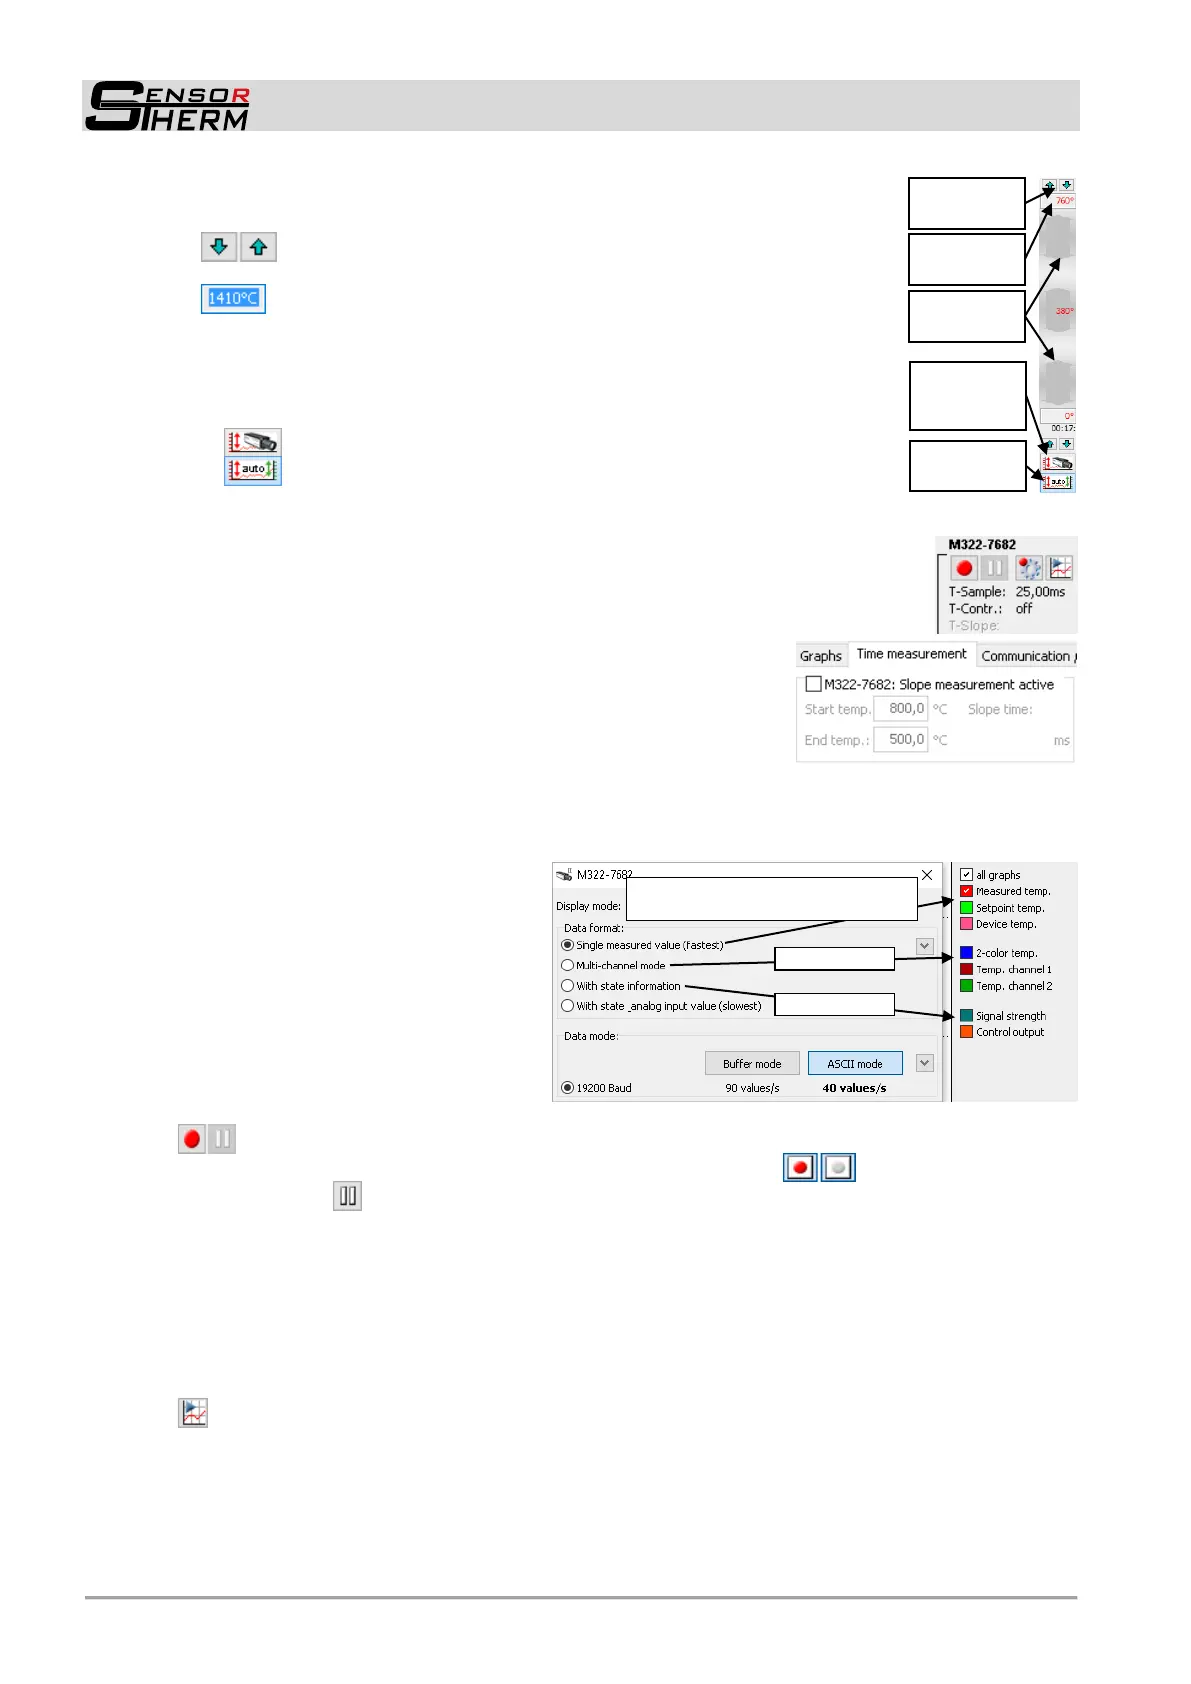
Scale the graph: Beginning and end of temperature scale (left) and control out-
put (right) scale can be adjusted to represent the relevant area reasonable
-
Scale per mouse click: With the green arrows of the upper and
lower scale range is changed
-
Scale per entry: The upper and lower temperature can be entered
via the keyboard.
- Scale with mouse drag: With click, hold and drag on the gray arrows, the
start and end or the entire area can be moved.
- Automatic scale: automatically adjusts the scale (+10°C above the maxi-
mum value and -10°C below the minimum value):
- reads out the pyrometers temperature range
- selects the range from all selected display graphs and always the
highest measured value.
Information field
- M322-7682 in the example right shows pyrometer model and serial number.
- The sampling time T-Sample Shows the time between the last two received
measured values.
- The control time T-Contr. shows the time a control process of the PID control-
ler is running already.
- When the slope time measurement is activated, the slope time
T-Slope shows the time elapsed between the start and the end
temperature. The settings can be found in the "Time measure-
ment" window.
Select display graphs:
Depending on the data acquisition setting (see 7.2.3.4 Data Collection (Buffer Mode)), different
graphs can be shown or hidden.
The color can be changed by right-clicking on a color field.
- To select and view multiple tem-
perature channels (e.g. 2-color + 1-
color temperature), at least the multi-
channel mode must be set.
- To display the signal strength, the
multi-channel mode with status in-
formation must be selected.
- For displaying of the setpoint of the
PID controller, the multi-channel
mode with status information should
preferably be selected.
The transferred measured value data can be recorded on hard disk for subsequent analysis.
Click on the recording button to start and stop recording, the button ( ) flashes when the re-
cording is active, Pause interrupts the recording. When recording is active, a red reference text
(create file ...) is displayed above the graphics window.
The amount of data that can be recorded depends on the baud rate (see also 7.2.3.3) and the set-
tings under data collection (buffer mode), see 7.2.3.4.
Note when using the PID controller: The recording may be performed together with the controller
start, when the corresponding setting is activated (see 7.2.3 Device Settings and Configuration
Data recording settings „automatic recording by: “active control“ as well as “automatic stop of re-
cording by: inactive control “).
The playback button starts the SensorTools viewer (see 7.3) and represents the last temporarily
stored measurement data, since the device was connected. These are not stored on hard disk as in
recording, only buffered. The amount of data depends on the value "Maximum records in memory"
(see Data recording settings next page). Each measurement storage consists of a data set: meas-
urement temperature, date, time, emissivity, device temperature, setpoint if used, etc., and the higher
the baud rate and transmission rate, the faster the value is reached.
Data displayed in the SensorTools Viewer can be saved directly in the viewer.
Adapt to
pyrometer’s
temp. range
Measured temp. is the tempera-
ture selected in the control window
 Loading...