171
Chapter 10: Statistics & Regression Calculations
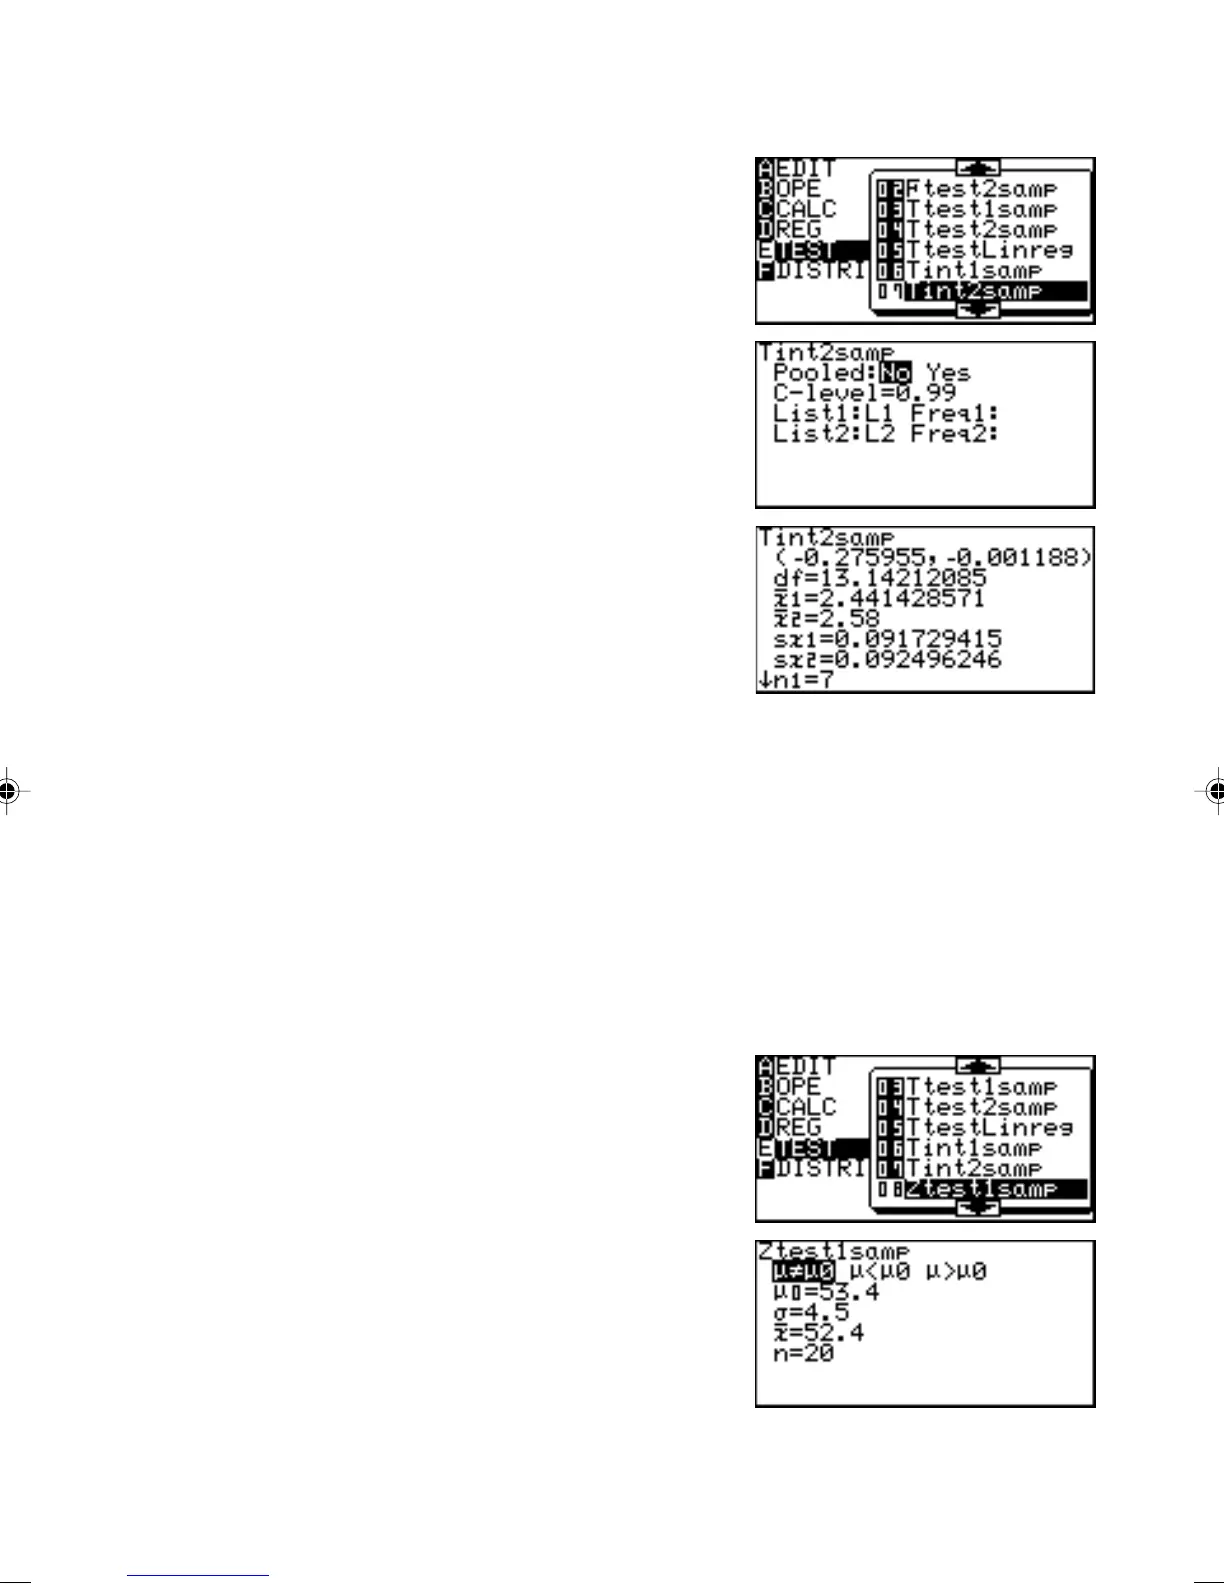
1. Enter the above data in to lists L1 and L2.
2. Press S E 0
7.
The parameter input screen
will appear.
3. Enter the appropriate value
in each field.
4. Press @ h.
Answers are displayed on
the screen, where the
numerical value within ()
indicates the confidence
interval for the differences
between µ
1
and µ
2
when the
level of confidence is 99%.
In the numerical value input
mode, “n
1
”, “n
2
” are positive integers.
08 Ztest1samp Tests the hypothesis of population mean µ.
Example
The average weight of a newly developed product is known to be
53.4 g and standard deviation (σ) is 4.5. Judge the validity when
the average weight of 20 units is 52.4 g (x).
Set the input method to value input mode
1. Press # S E 1 7 E.
2. Press S E 0
8.
The parameter input screen
will appear.
3. Set the alternate hypothesis
to µ ≠ µ
0
, µ < µ
0
and µ > µ
0
(two-tail test, one-tail test
settings). In this case,
choose µ ≠ µ
0
(two-tail test).