Alpy 600 - user guide
a spectrum like this:
In astronomical imaging, the signal level (light level)
is very low and all the instrumental defects are pro-
portionally more important. It is even more impor-
tant therefore to acquire the whole set of reference
images, to ensure good data reduction.
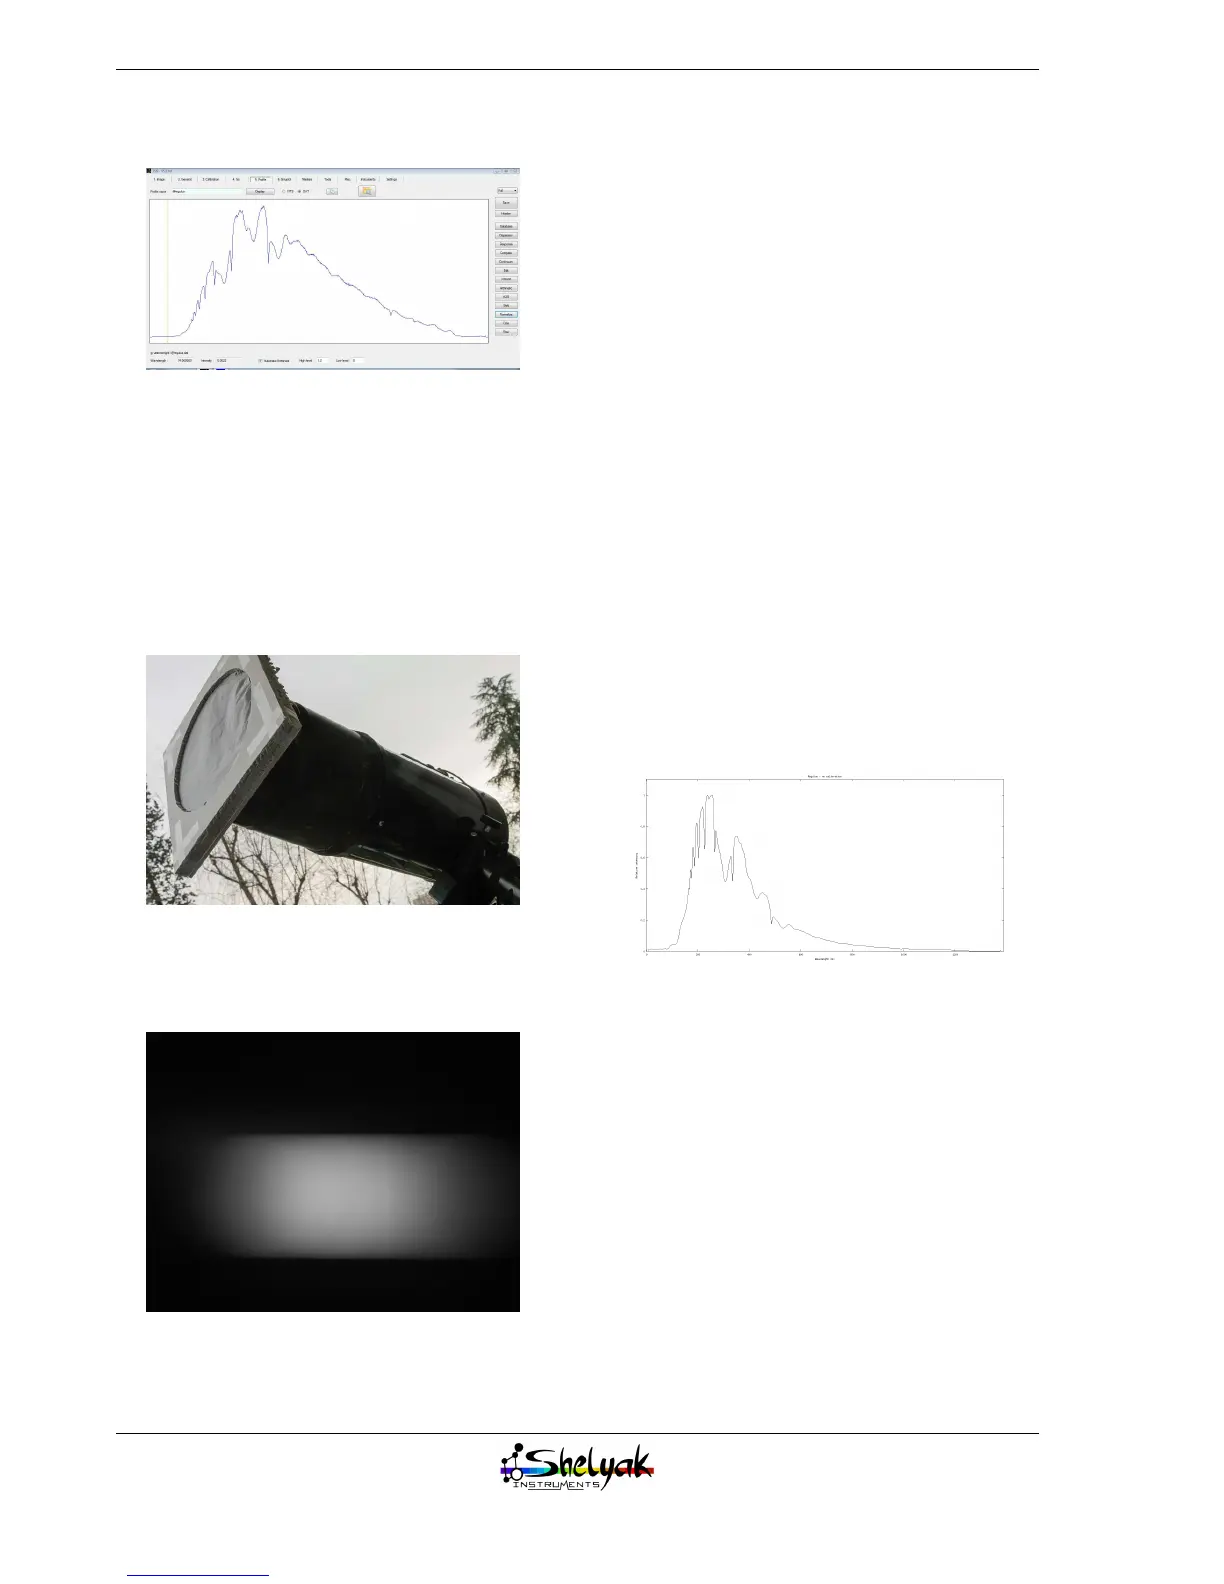
In slitless mode, the flat field spectrum can be pro-
duced by putting a diffuser in front of the telescope
(see an example below), and illuminating it with a
tungsten or halogen lamp (during the night, to pre-
vent any sunlight polluting the image).
The result will be like this (in flats taken without a
slit, there is no evidence of the response curve. All the
details are smoothed out):
The wavelength calibration and response curve cor-
rection will both be extracted from a reference star
spectrum.
Here is the list of the reference images you need to
take in slitless mode, to ensure a proper data reduc-
tion:
– 7 offset image or more (same as before)
– 7 dark images or more (same as before)
– 5 flat field images or more (take care of the right
exposure time to get 80% of the maximum level)
– 5 spectra of the reference star (A or B type) or
more
– Point at several stars (adapt the exposure time
for each star), and take 3 to 15 spectra of each of
them.
3.4 data reduction
Create master files for offset, dark, flat fields, and a
cosmetic file from the master dark,
As you learnt in chapter 2, reduce your data in
three steps to obtain the wavelength calibration and
instrumental response curve.
3.4.1 First pass
First run the data reduction without wavelength
calibration and response curve correction. You should
get this (note that ISIS can export your profiles as
PNG, using the GnuPlot graphics tool):
This profile is different from the first Regulus one
because here we used the flat field. It is closer to the
actual star spectrum, but is still strongly affected by
the instrumental response curve.
3.4.2 Second pass
The wavelength calibration law can be established
using the Balmer lines (hydrogen lines), which are
the most visible in the spectrum. They are spread out
all along the visible spectrum, like a geometrical se-
ries. Here is the list of Balmer lines:
30