Chapter 9 Reference Manual
Ranger E/D
106 ©SICK AG • Advanced Industrial Sensors • www.sick.com • All rights reserved
Hardware Description
Calculation of Sensor Response of the sensor for a given amount of light incident on the
sensor follows the steps below:
Make an approximation of the wavelength content in your light source.
Map the shape of the wavelength content of the light source to the spectral curve of the
sensor above, and read (AD units per pixel)/(µJ/cm
2
) for one or several wavelengths.
Determine the integration time for your application.
Translate the gray value per energy from the curve above to gray value per power by
multiplying the value with the integration time.
Determine the incident light power on the sensor (irradiance, W/m
2
) in your application.
Multiply this value with the sensitivity from step 4. The resulting sensor response is
given as a digital gray value in AD units.
Example:
A laser light source with a maximum incident power of 0.05 W/m
2
(on the sensor area) at
725 nm.
The integration time is 10 ms.
The laser will at 725 nm give a sensitivity of approximately 2600 (AD units per
pixel)/(µJ/cm
2
).
The sensitivity will be 2600 x 10
6
x 10
-4
x (10 x 10
-3
) = 2600 AD units/(W/m
2
).
On the sensor 0.05 W/m
2
will be incident.
The response will be 2600 x 0.05 = 130 AD units per pixel.
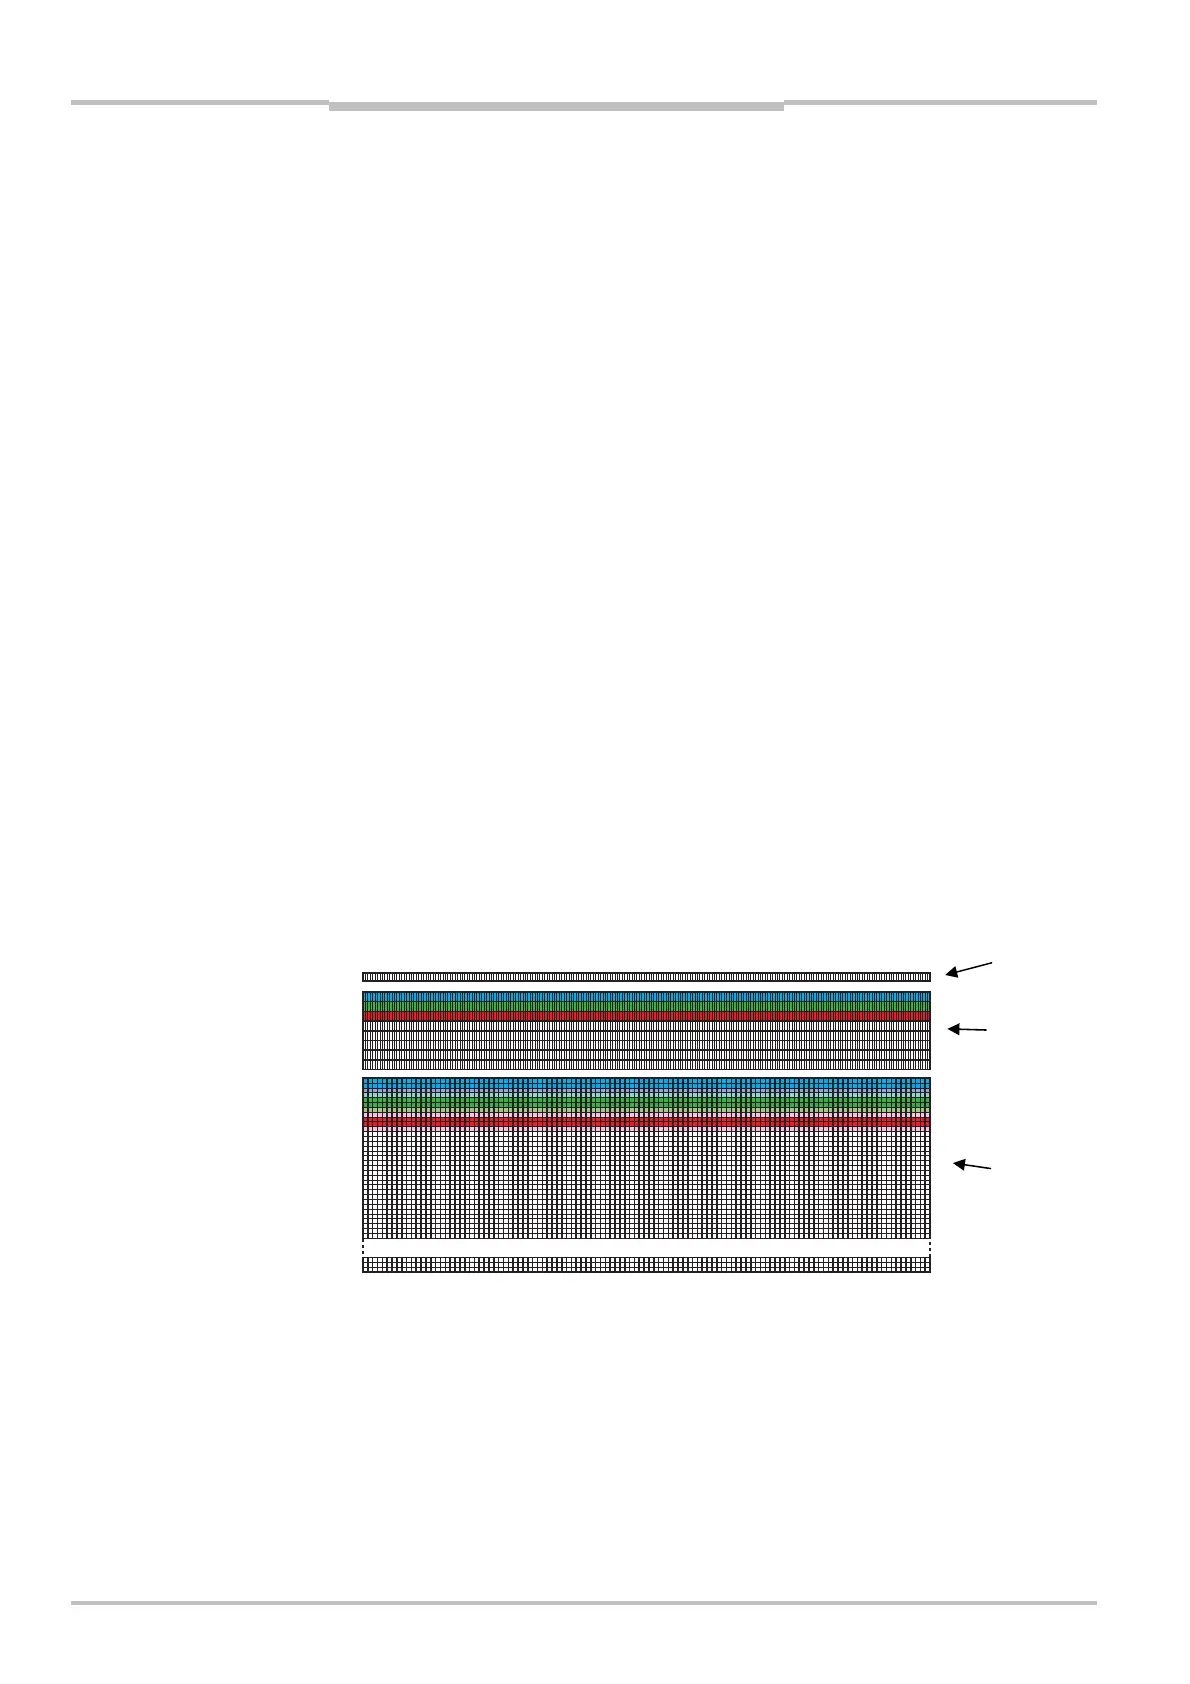
9.1.2 Color Filter Layout
The sensor on the ColorRanger has rows with color filters. The filter layout is shown in the
following figure. There are two filter regions, one on the standard sensor region and one on
the high-resolution region.
The distance between the color rows in the standard sensor region is 4 rows.
On the high-resolution part the distance between the color lines is only 1 row, which
means that the colors appear on adjacent pixels, even though the row pitch is larger.
0
511
512
514
518
522
526
Figure 9.2 – Color filter layout. The sensor has a standard region and a high resolution
region. Both regions have color filter rows. The topmost row 512 is the gray-
scale high-resolution row, which is also present in Ranger E55.
The main filter section is red-green-blue rows on the sensor. In addition there are sections
sensitive to other wavelength bands as shown in the table below. The high-resolution rows
are addressed using addresses above the normal 0-511 range, with the gray high-
resolution row being row 512.
High-resolution
color rows
Standard
rows
High-resolution
gray row