Chapter 9 Reference Manual
Ranger E/D
108 ©SICK AG • Advanced Industrial Sensors • www.sick.com • All rights reserved
Hardware Description
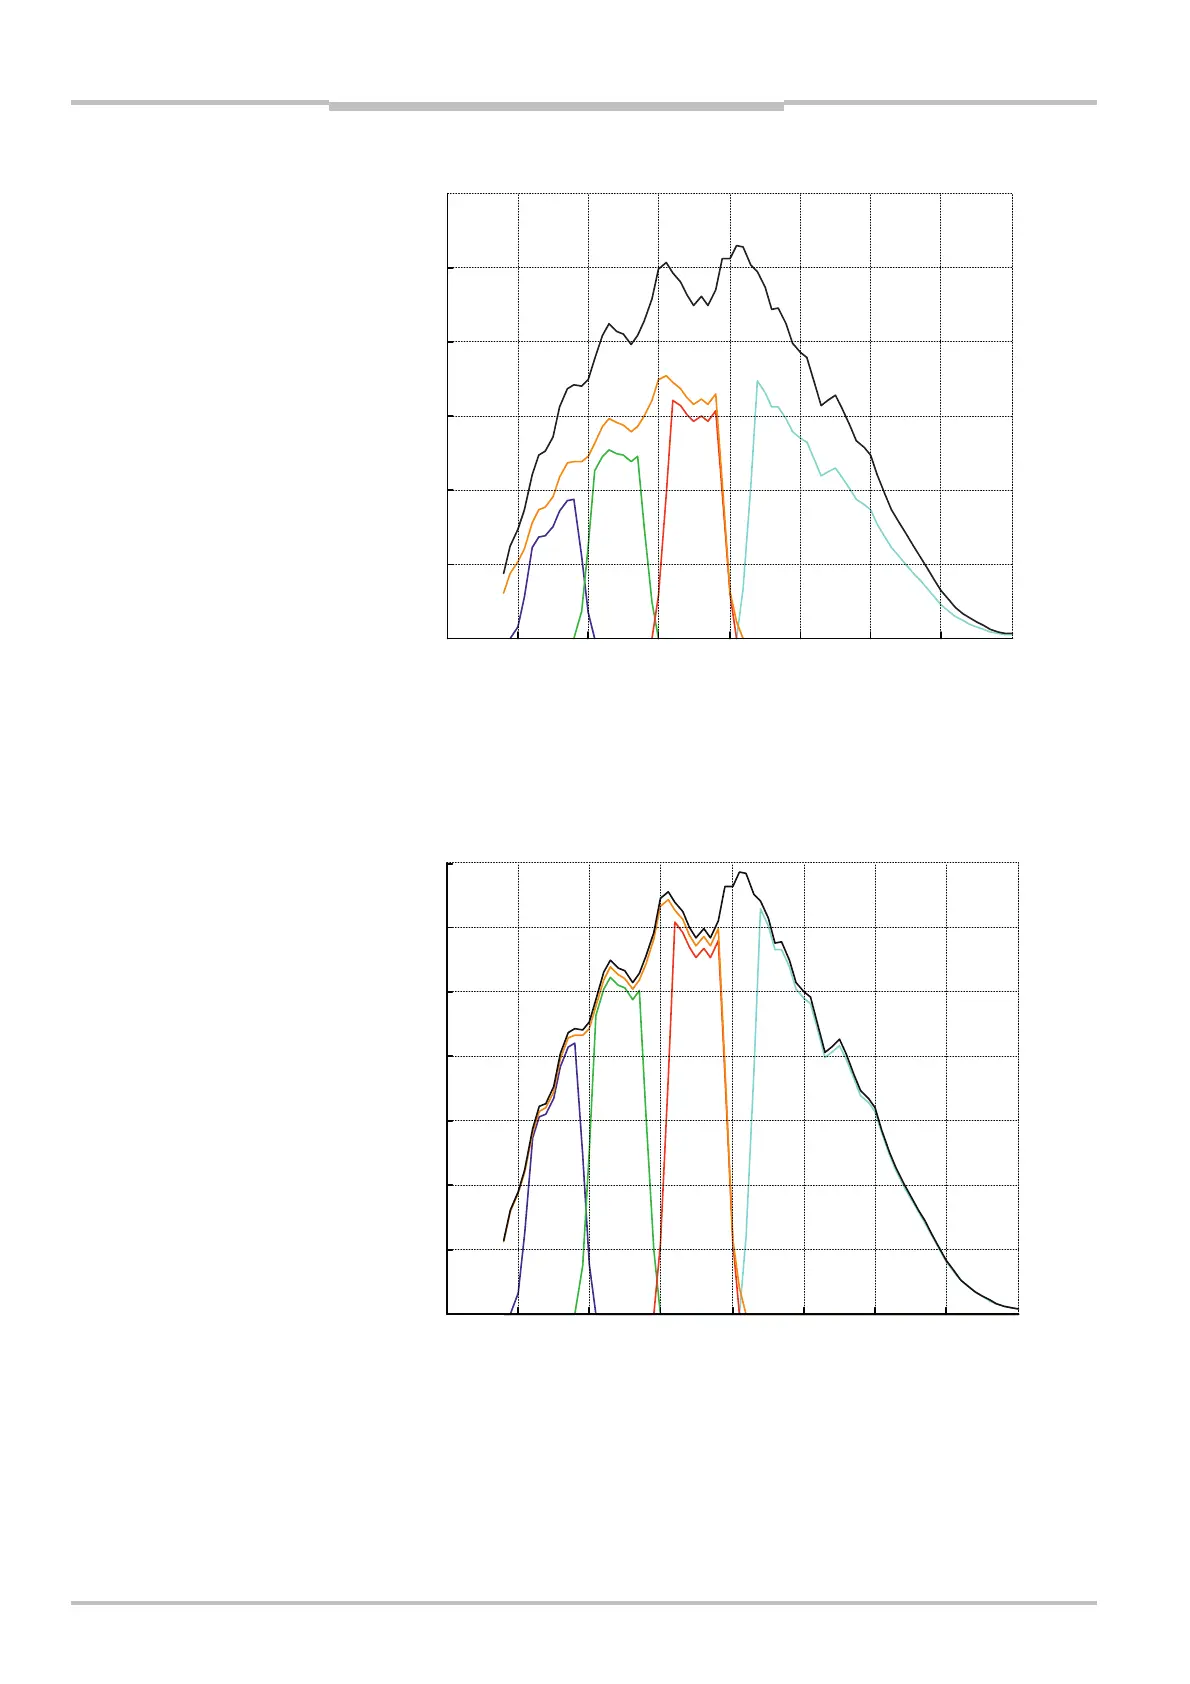
300 400 500 600 700 800 900 1000 1100
0
500
1000
1500
2000
2500
3000
Figure 9.3 – Approximate filter response for the M12 standard color filtered rows. The
black line shows the response for uncovered rows, the orange line the IR
block filter, and the light blue line the IR pass filter.
300 400 500 600 700 800 900 1000 1100
0
500
1000
1500
2000
2500
3000
3500
Figure 9.4 – Approximate filter response for the M12 high-resolution color rows. The
black line shows the response for uncovered rows, the orange line the IR
block filter, and the light blue line the IR pass filter.
Li
ht wavelen
th
nm
Response
[ADu per pixel / (µJ/cm
2
)]
M12 Color Response
Li
ht wavelen
th
nm
Response
[ADu per pixel / (µJ/cm
2
)]
M12
Hi
Res
Color Response