Chapter 4 Reference Manual
Ranger E/D
30 ©SICK AG • Advanced Industrial Sensors • www.sick.com • All rights reserved
Ranger Studio
0
512
514
518
522
528
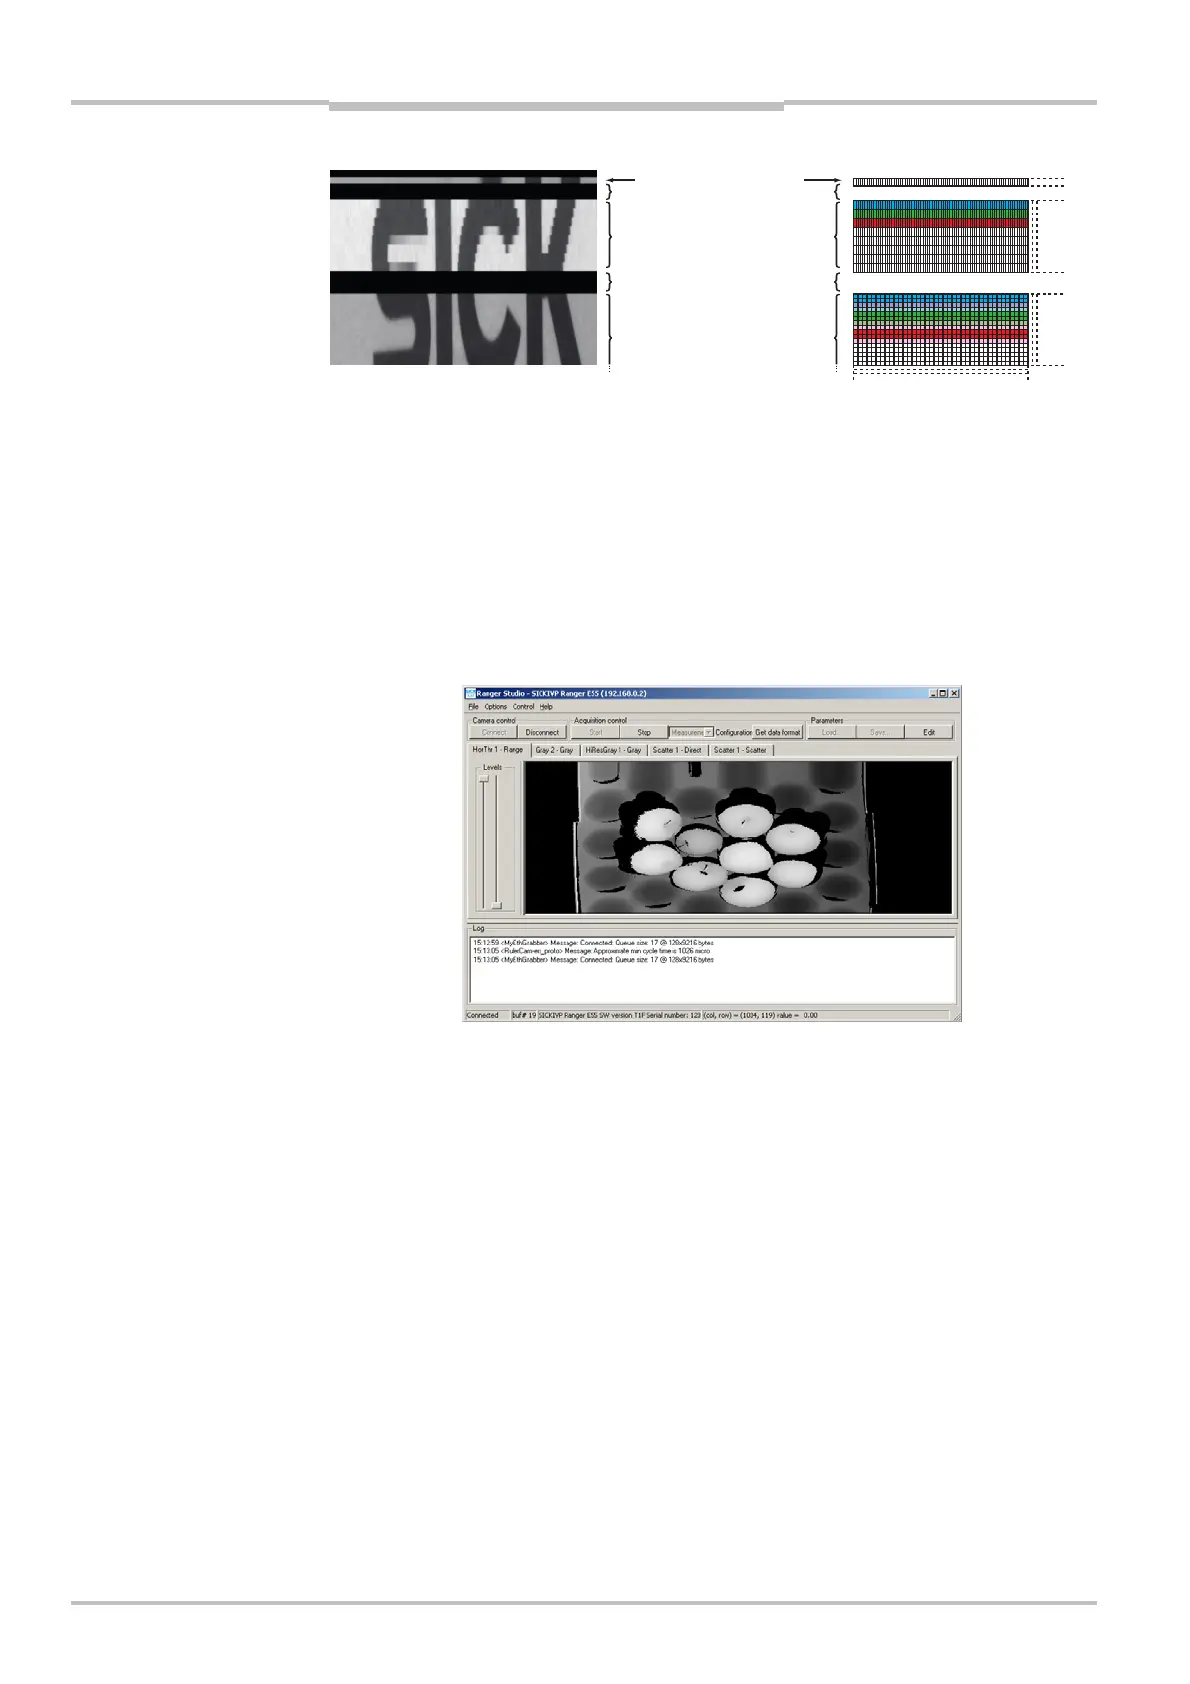
Figure 4.3 – An image showing the high resolution part and the 32 first sensor rows on
the standard sensor region. Note the black areas, brighter color high-
resolution part, and the reduced vertical resolution of the high-resolution
rows.
Measurement Mode
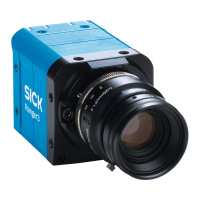
When the Ranger is running in Measurement mode, the main window contains visualiza-
tion tabs for each active component in the configuration. If a component produces more
than one type of profiles, there is one tab for each type of profile. Each tab shows an
image made from the corresponding profiles sent from the Ranger.
Figure 4.4 – Main window with tabs for range, scatter and intensity images.
The visualization tabs always shows the range measurement data as an 8-bit grayscale
image. This means that the original range measurement values are translated to 255
grayscale values, where 1 (black) corresponds to the lowest range value and 255 (white)
corresponds to the highest value. The value 0 means missing data.
To display the actual measured value for a point in the visualized image, place the pointer
over the point in the image. The value, together with the coordinates for the point, will be
displayed in the status bar and in the Info window, if open.
When measuring color, the color information for each acquired color is displayed as gray-
scale images in one tab each, and one tab with a compound color image. To get a proper
compound color image, you have to set up the registration parameters. See “Visualizing
Color Images” on page 39 for more information.
H
-Res gray ro
H
-Res color rows
Standard sensor
rows
Area between rows
Image in Ranger Studio
ensor layout