Precision and Accuracy
The iGlucose®Essential blood glucose monitoring system was tested for
within-run precision (300 measurements per glucose concentration for
repeatability) using venous whole blood samples and intermediate
precision (30 measurements per glucose concentration a day for 10 days)
using glucose controls.See tables below for results.
Linearity Results:
Lot 1: y = 0.9982x-1.2760; R
2
= 0.9975.
Lot 2: y = 0.9945x-1.1411; R
2
= 0.9982.
Lot 3: y = 0.9949x+0.1534; R
2
= 0.9973.
All 3 Strips Lots: y = 0.9959x-0.7546; R
2
= 0.9976.
The results support the claimed measurement range of 20-600 mg/dL.
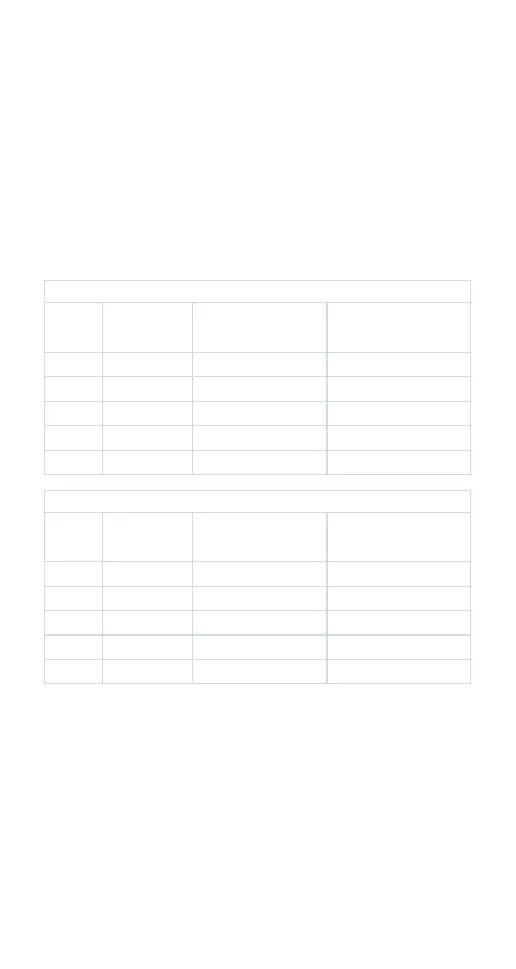
Within-Run Precision
Standard Deviation
(SD)
Coecient of Variation
(CV)
Coecient of Variation
(CV)
Glucose
Concentration
Interval
39.8 mg/dL
70.5 mg/dL
127.9 mg/dL
199.0 mg/dL
349.6 mg/dL
1.8 mg/dL
2.3 mg/dL
3.6 mg/dL
5.9 mg/dL
10.2 mg/dL
1
2
3
4
5
Intermediate Precision
User Evaluation:
The iGlucose®Essential blood glucose monitoring system was tested by
352 lay users using capillary blood samples and three iGlucose®Essential
blood glucose test strips lots. The results were compared to the YSI
Model 2300 STAT PLUS Glucose Analyzer, a laboratory instrument. See
the table below with accuracy performance study results that shows the
iGlucose®Essential blood glucose monitoring system achieved 100% of
results within ±15% of the laboratory instrument. The results show here
are intended to inform you about your meter, how much results are
consistent from your actual blood glucose values.
Standard Deviation
(SD)
Glucose
Concentration
Interval
40.0 mg/dL
70.1 mg/dL
129.8 mg/dL
199.5 mg/dL
349.9 mg/dL
4.5%
3.2%
2.8%
3.0%
2.9%
1.8 mg/dL
2.0 mg/dL
3.1 mg/dL
4.6 mg/dL
7.9 mg/dL
4.6%
2.9%
2.4%
2.3%
2.3%
1
2
3
4
5
16