Radlabor GmbH | Heinrich-von-Stephan-Str. 5c | 79100 Freiburg | Germany
www.smartfit.bike | www.radlabor.de
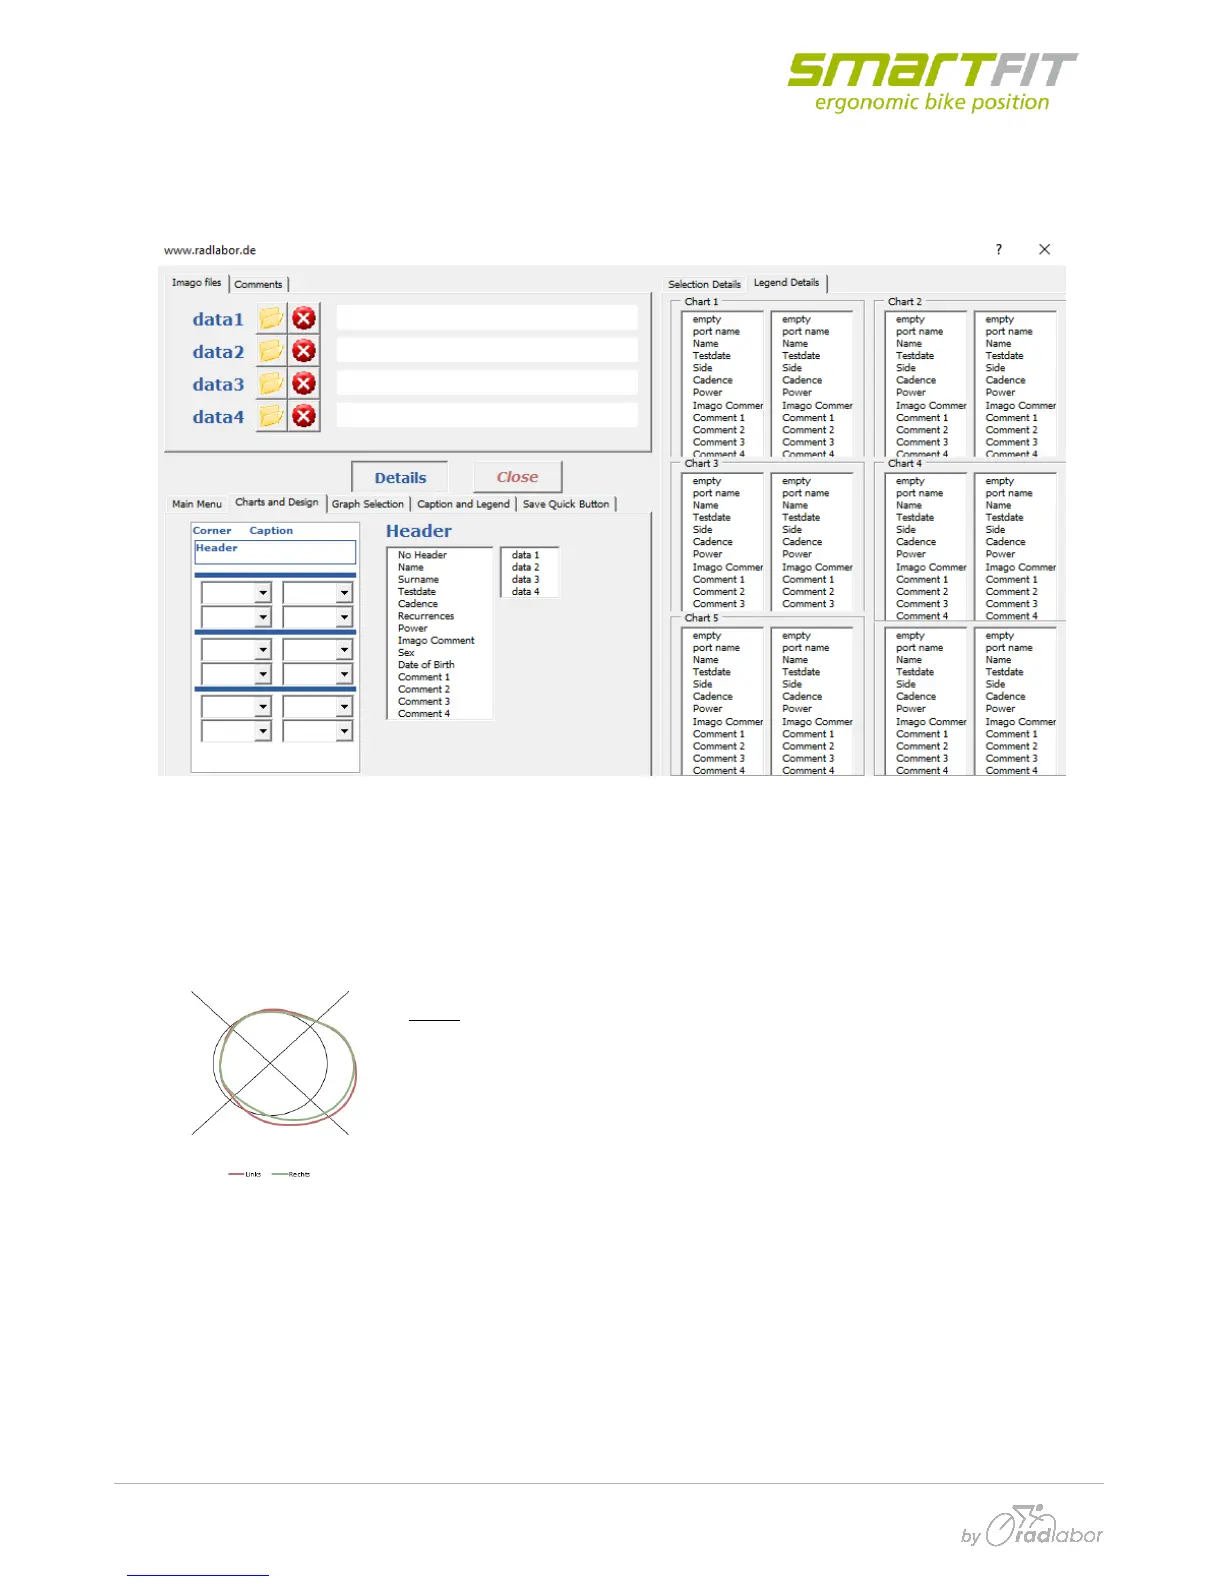
5.2 Charts and Design
Here you can select different chart types. All available charts are shown below.
The sheet is divided into six areas, where charts can be plotted. There are also description fields
available.
If you click on “Corner”, “Caption” or “Header” you can arrange the header and the headline of the
print sheet. The information is taken from the loaded raw data files. Multiple choices are impossible.
Cycle: In this chart the data is plotted in a circle. The black circle is zero.
Positive data is outside the black circle. Negative data is inside it.