D19 MicVALVE
D3/2 Zusätzliche Informationen Date printed: 9.2.2000
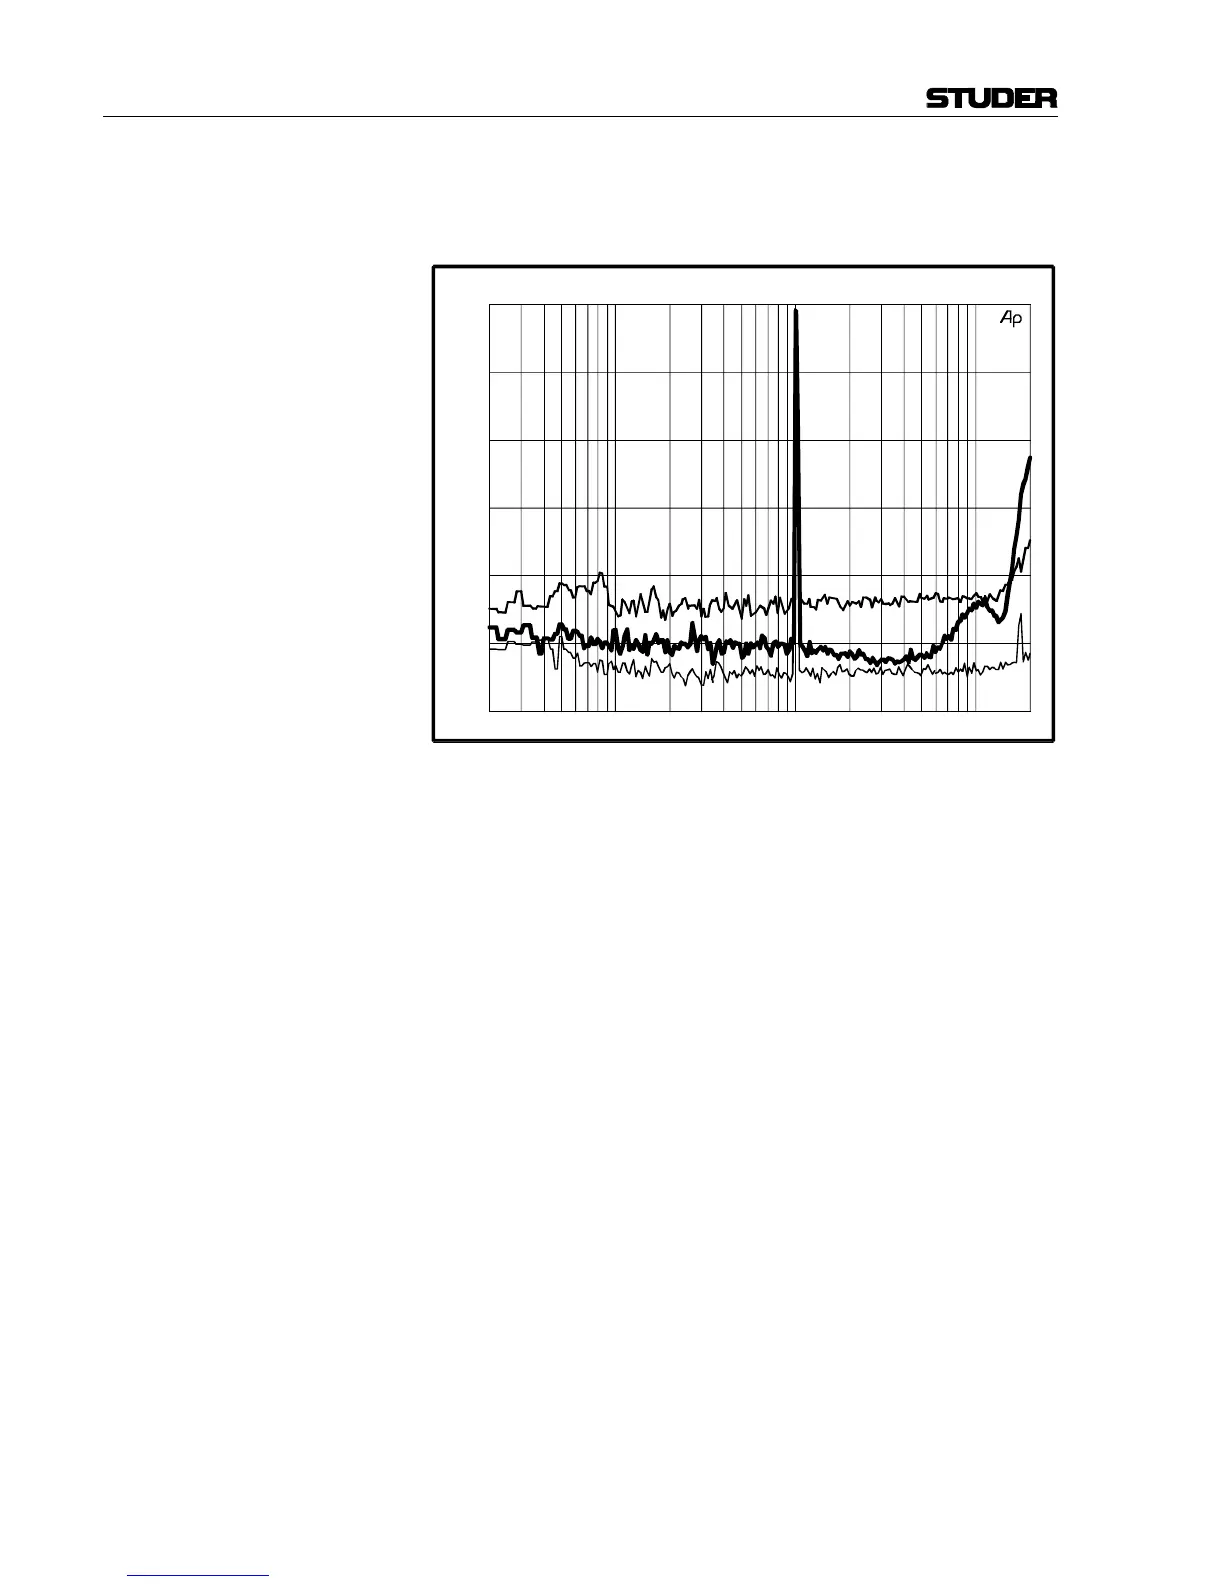
Kurve (3) im folgenden Diagramm zeigt das Spektrum des 16 bit-Signals
nach der Anwendung von Noise Shaping. In Kurve (4) ist das selbe Spek-
trum nach der Bearbeitung mit Dither dargestellt.
Weiterführende Informationen über Noise Shaping- und Dithering-Technik
erhalten sie auf Wunsch bei Ihrer nächsten Studer-Vertretung.
(4)
(3)
D19 MicVALVE
-150.0
-140.0
-130.0
-120.0
-110.0
-100.0
-90.00
20 100 1k 10k 20k
AMP1(dB
FS
) vs FREQ(Hz) & SWI(#)