92
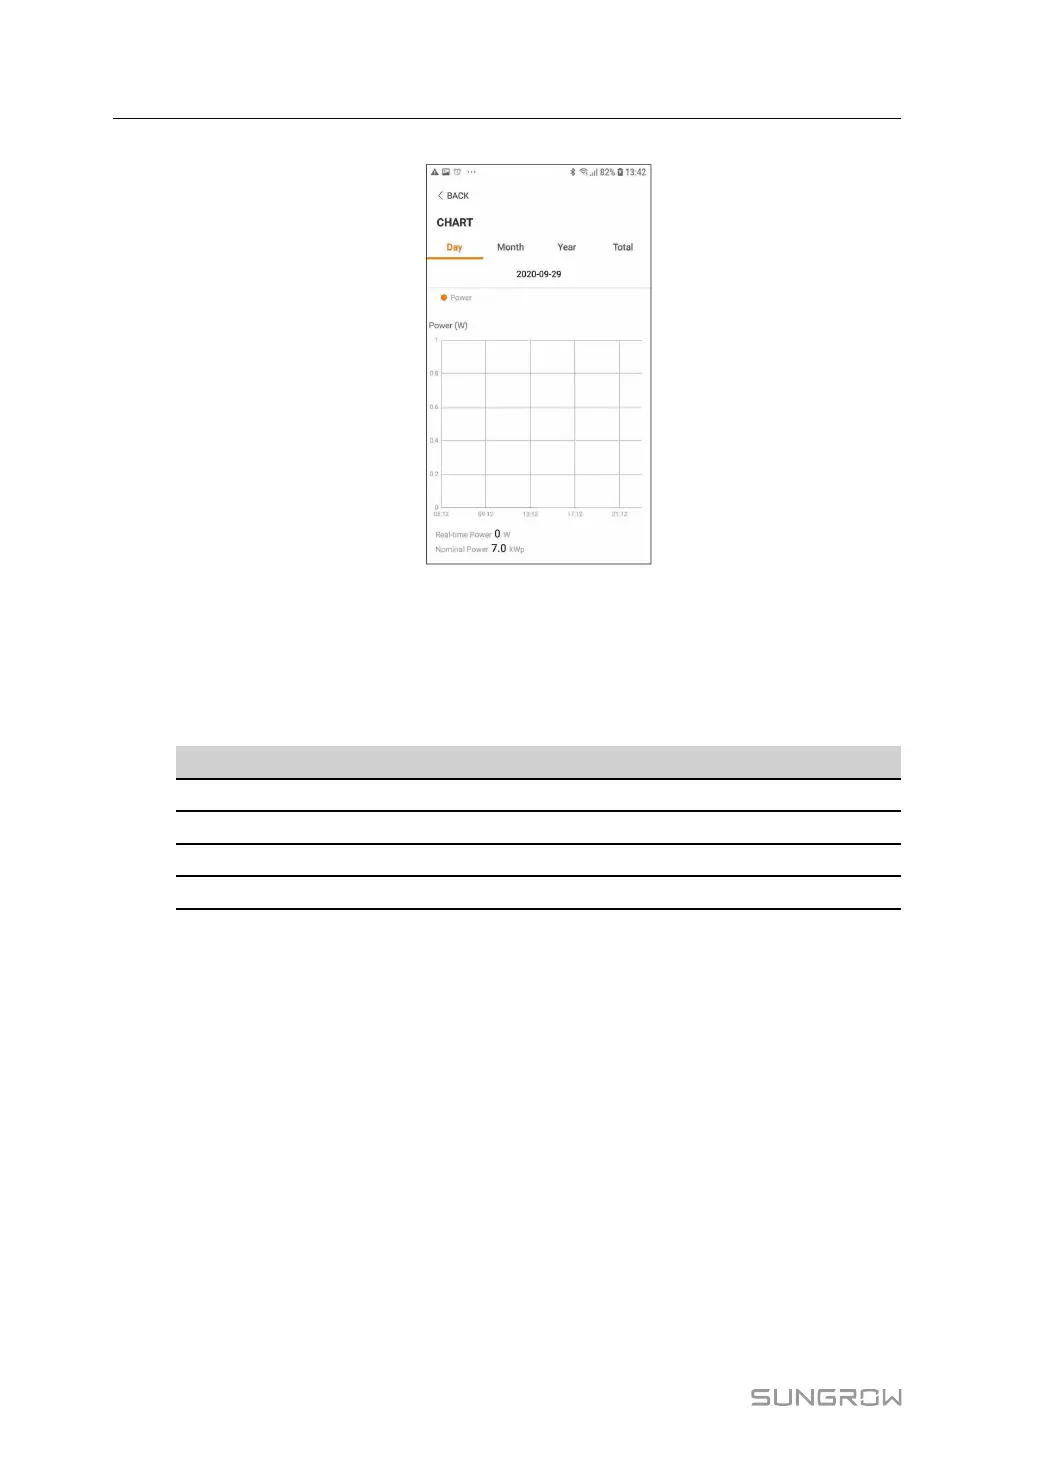
figure 7-7 Chart
The App displays power generation records in a variety of forms, including daily power gen-
eration graph, monthly power generation histogram, annual power generation histogram
and total power generation histogram.
table 7-3 Description of Power Curve
Item
Description
Daily Daily curve that indicates the real-time power.
Month
Monthly curve that indicates daily yield and equivalent hours in a month.
Year
Annual curve that indicates monthly yield and equivalent hours in a year.
Total
A curve that indicates annual yield and equivalent hours since installation.
Fault Alarm Record
Tap Fault Alarm Record to enter the screen, as shown in the following figure.
7 iSolarCloud App User Manual