80-0067-00-MO-RevF 2017-10-03 SunTech CT40 User Manual | 27
Masimo
®
M-LNCS
TM
sensors are provided non-sterile.
Additional Masimo
®
Information:
In addition to the General Principles of Operation mentioned above, the Masimo
®
SET
®
MS board pulse oximeter uses
the following principle:
The MS board decomposes the ratio of pulsatile absorbance (AC) to the mean absorbance (DC) at each of two
wavelengths, 660 nm and 905 nm (S(660) and S(905)) into an arterial signal plus a noise component and calculates
the ratio of the arterial signals without the noise:
S(660) = S1 + N1
S(905) = S2 + N2
R = S1/S2
Again, R is the ratio of two arterial pulse-added absorbance signals and its value is used to find the saturation SpO
2
in
an empirically derived equation into the oximeter’s software. The values in the empirically derived equation are based
upon human blood studies against a laboratory co-oximeter on healthy adult volunteers in induced hypoxia studies.
The above equations are combined and a noise reference (N’) is determined:
N’ = S(660) - S(905) x R
If there is no noise N’ = 0: then S(660) = S(905) x R which is the same relationship for the traditional pulse oximeter.
The equation for the noise reference is based on the value of R, the value being sought to determine the SpO
2
. The
MS board software sweeps through possible values of R that correspond to SpO
2
values between 1% and 100% and
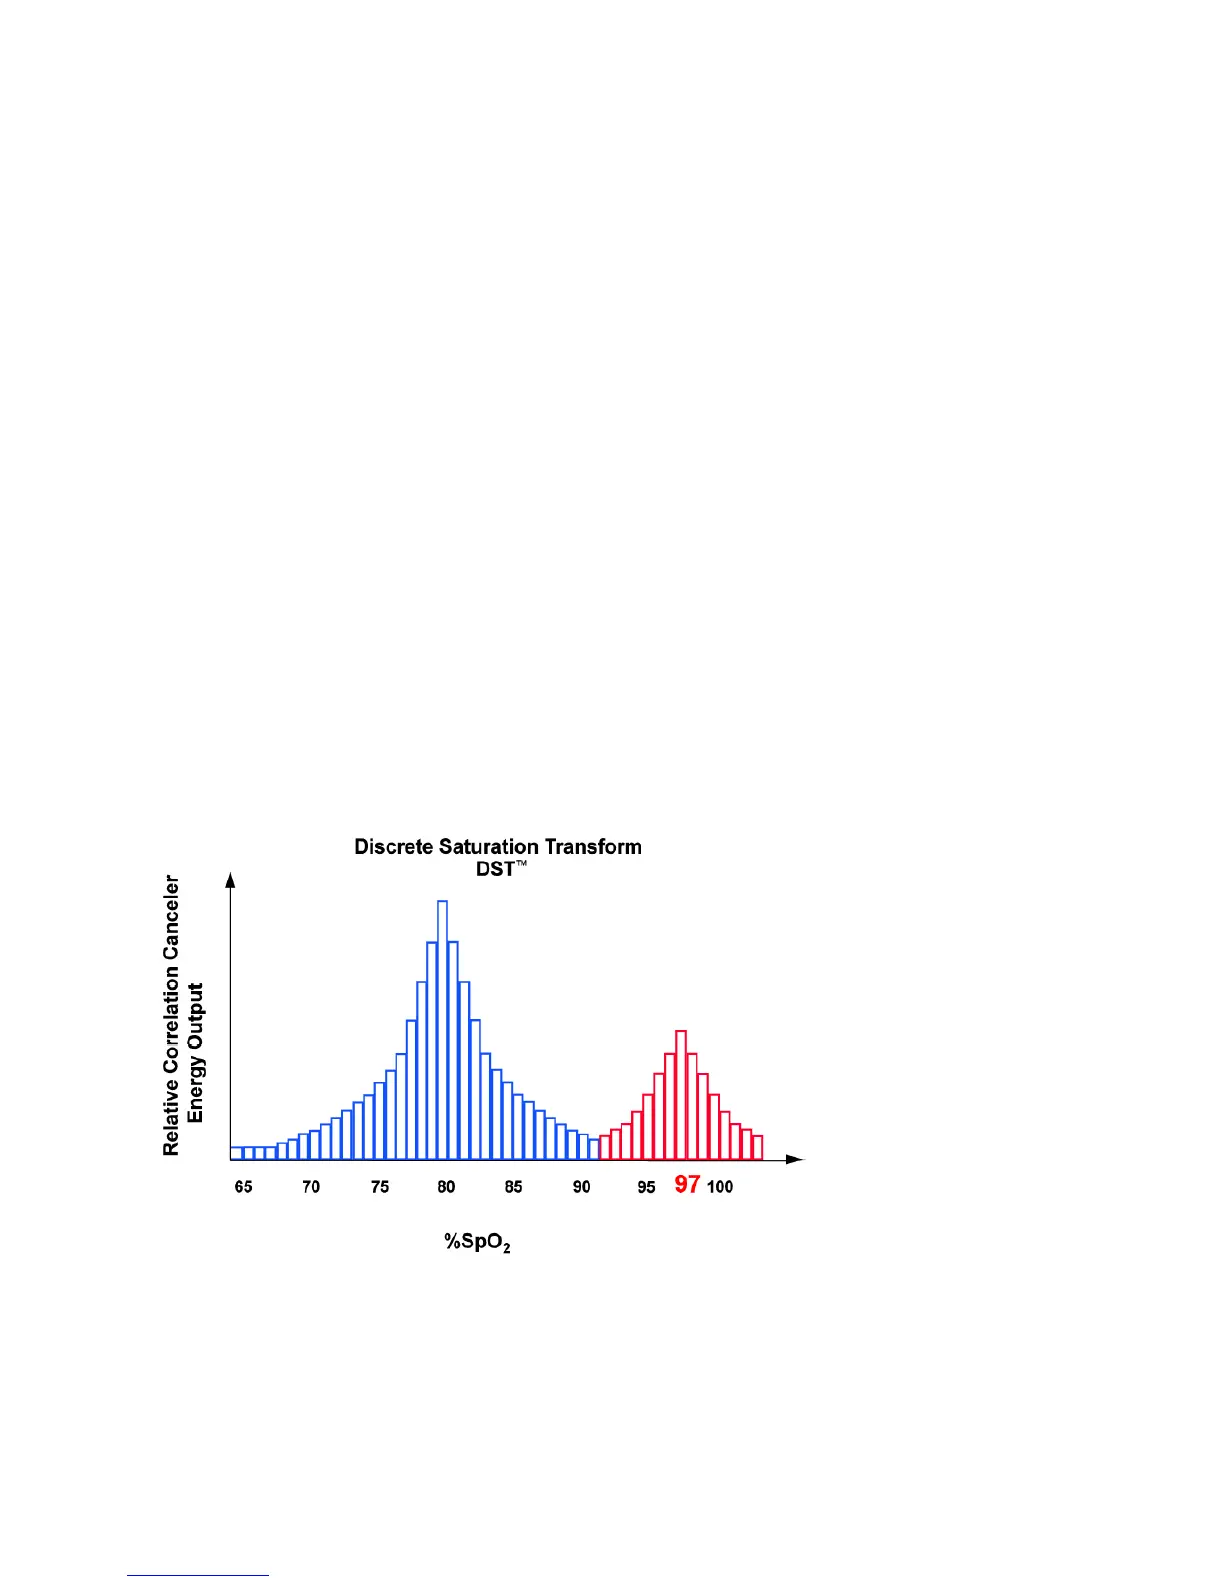
generates an N’ value for each of these R-values. The S(660) and S(905) signals are processed with each possible N’
noise reference through an adaptive correlation canceler (ACC) which yields an output power for each possible value
of R (i.e., each possible SpO
2
from 1% to 100%). The result is a Discrete Saturation Transform (DST™) plot of relative
output power versus possible SpO
2
value as shown in the following figure where R corresponds to SpO
2
= 97%:
The DST plot has two peaks: the peak corresponding to the higher saturation is selected as the SpO
2
value. This
entire sequence is repeated once every two seconds on the most recent four seconds of raw data. The MS board
SpO
2
therefore corresponds to a running average of arterial hemoglobin saturation that is updated every two
seconds.