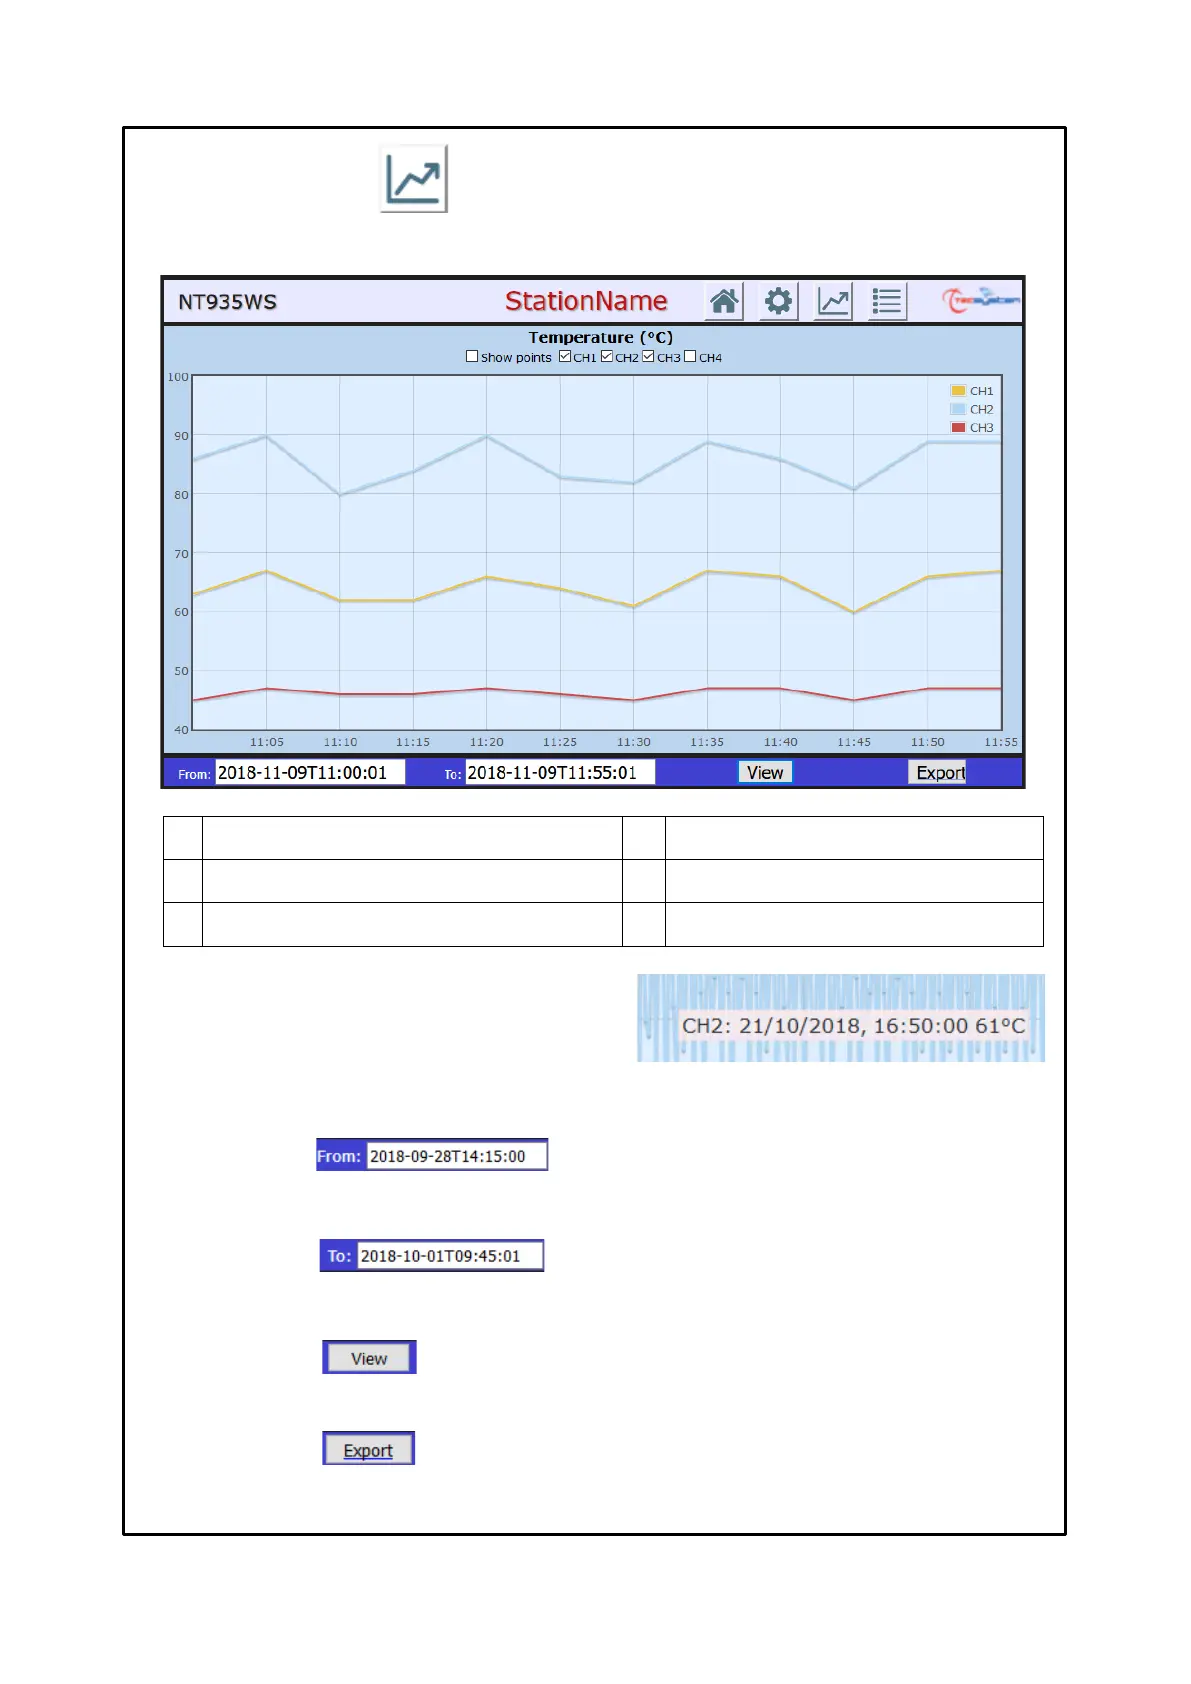
GRAPHICS SCREEN
The Graphics screen allows the user to view the temperature trend of the enabled channels, CH1-CH2-CH3-CH4 graphic
view notes on page 28. Data saving can be programmed according to user needs by changing the sampling range, options
screen on page 25.
By pressing the EXPORT button, all the temperature values recorded according to the FROM/TO selections can be
downloaded in CSV format (text file). Export notes CSV file on page 28.
Recording points display flag
Data availability A yy/mm/dd Time: hh/mm/ss
CHn channel enabling flag
Data availability DA yy/mm/dd Time: hh/mm/ss
Pressing the VIEW button will update the chart according to the dates selected FROM/TO.
It allows the user to select the period of graphic display by changing the data availability from yy/mm/dd -
Time: hh/mm/ss
It allows the user to select the period of graphic display by changing the data availability to yy/mm/dd -
Time: hh/mm/ss
CH channel selection flag
Enable / disable the graphic display of the individual CHn channel.
Recording points display flag
Enabling the recording points display flag it will be possible to
identify each recording in the graph. Clicking on the individual point
will show the information of: channel, date, time and recorded
temperature value.