Analyze Wavefor
morTraceData
Analyze Wavef
orm or Trace Data
After having properly set up the acquisition, triggering, and display of your desired waveform or trace, you can analyze the
results. Select from features such as cursors, automatic measurements, statistics, waveform histograms, math, and FFT.
Using M arkers in the Frequency Domain
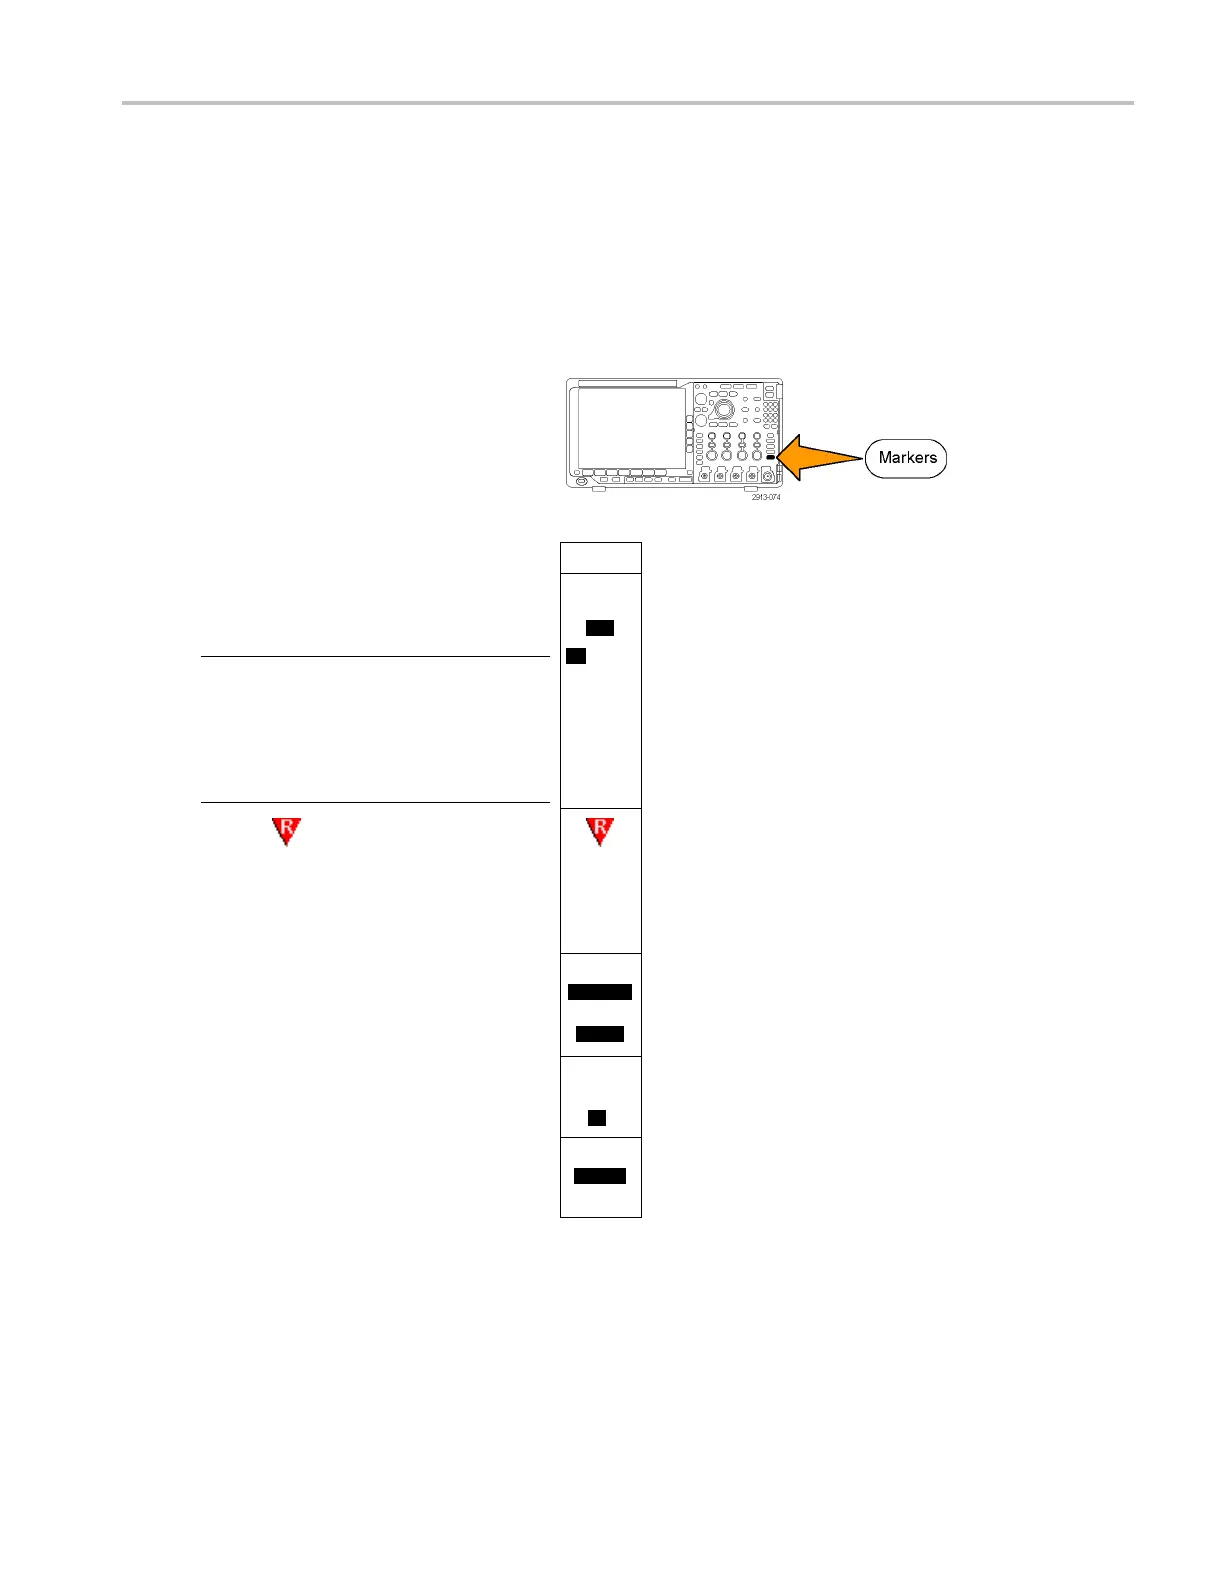
1. Push Markers. T his brings up the Markers
side menu.
Markers
2. Push Peak Markers and turn multipurpose
knob a to se
lect how many peaks to label
on the display.
NOTE. This is the m aximum number of peaks
that will
be marked. If there are more peaks that
meet the threshold and excursion criteria than
the specified number of Peak Markers identified
in this c
ontrol, then only the specified number of
highest amplitude peaks will be marked.
Peak
Markers
(a) 5
On|Off
3. Push
To Centerto set the center frequency to the
frequency indicated by the Reference Marker.
The Reference Marker is automatically placed
on the highest amplitude peak.
To Center
4. Push Threshold and turn multipurpose
knob a to define the threshold of the peak
markers. Turn multipurpose knob b to define
their excursion value.
Threshold
-50.0
dBm
Excursion
30.0 d
B
5. Push Manual Markers to activate manual
markers. Use manual markers to m easure
non-peak areas of interest in the spectrum.
Manual
Markers
On|
Off
6. Push Readout to choose between Absolute
and Delta readouts. Delta readouts are
relative to the R eference Marker.
Readout
Absolute
Delta
MDO4000 Series Oscilloscopes User Manual 117
 Loading...