Reference
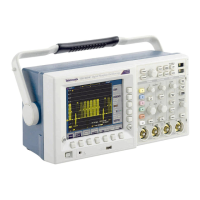
FFT Waveform
The FFT (Fast F ourier Transform) function mathematically converts the
standard time -d om ain signal (repetitive or sing le- shot acquisition) into
its frequency components, providing spectrum analysis capabilities.
YoucanusetheFFTfunctiontolook at the frequency components
and spectrum shape of a signal:
To test impulse response of filters and systems
To measure harmonic content and distortion in systems
To identify and locate noise and interference sources
To analyze vibration
To analyze harmonics in 50 and 60 Hz power lines
The FFT function provides the following features:
FFT Windows – Four FFT windows (Rectangular, Hamming,
Hanning, and Blackman-Harris) let you match the optimum
window to the signal y ou are analyzing. The Rectangular window is
best for nonperiodic events such as t ransients, pulses, a n d one-shot
acquisitions. The Hamming, Hanning, and Blackman-Harris
windows are better fo r period ic signals.
Analyze R epetitive, Single-Shot, and Stored Waveforms –You
can display an FFT waveform on any actively-acquired signal
(periodic or one-shot), on the last acquired sign al, or on any signal
stored in reference memory.
dB or Linear RMS Scales – The FFT vertical graticule can be
set to either dB or Linear RMS. A dB scale is useful when the
frequency componen t magnitudes cover a wide dynamic range,
letting you show bo th lesser and greater- magnitude frequency
components on the same d isplay. A Linear scale is useful when the
frequency component magnitu des are all close in value, allowing
direct comparison of their magnitudes.
Time Signals a nd FFT Waveforms Display ed To gether –The
time signals and FFT waveforms can be shown together on the
display. The time signal highlig hts the problem ; the FFT waveform
helps you determine the cause of th e problem .
TDS3000C Series O scilloscope User Manual 89
 Loading...