Read the warnings before the device is energized. Make sure that the device is connected according to
the connection diagram. When the device energized for the first time, the Home Screen is displayed. Enter
the current transformer ratio and the voltage transformer ratios, if installed, on the settings menu at first.
8 - Start-up of the Device:
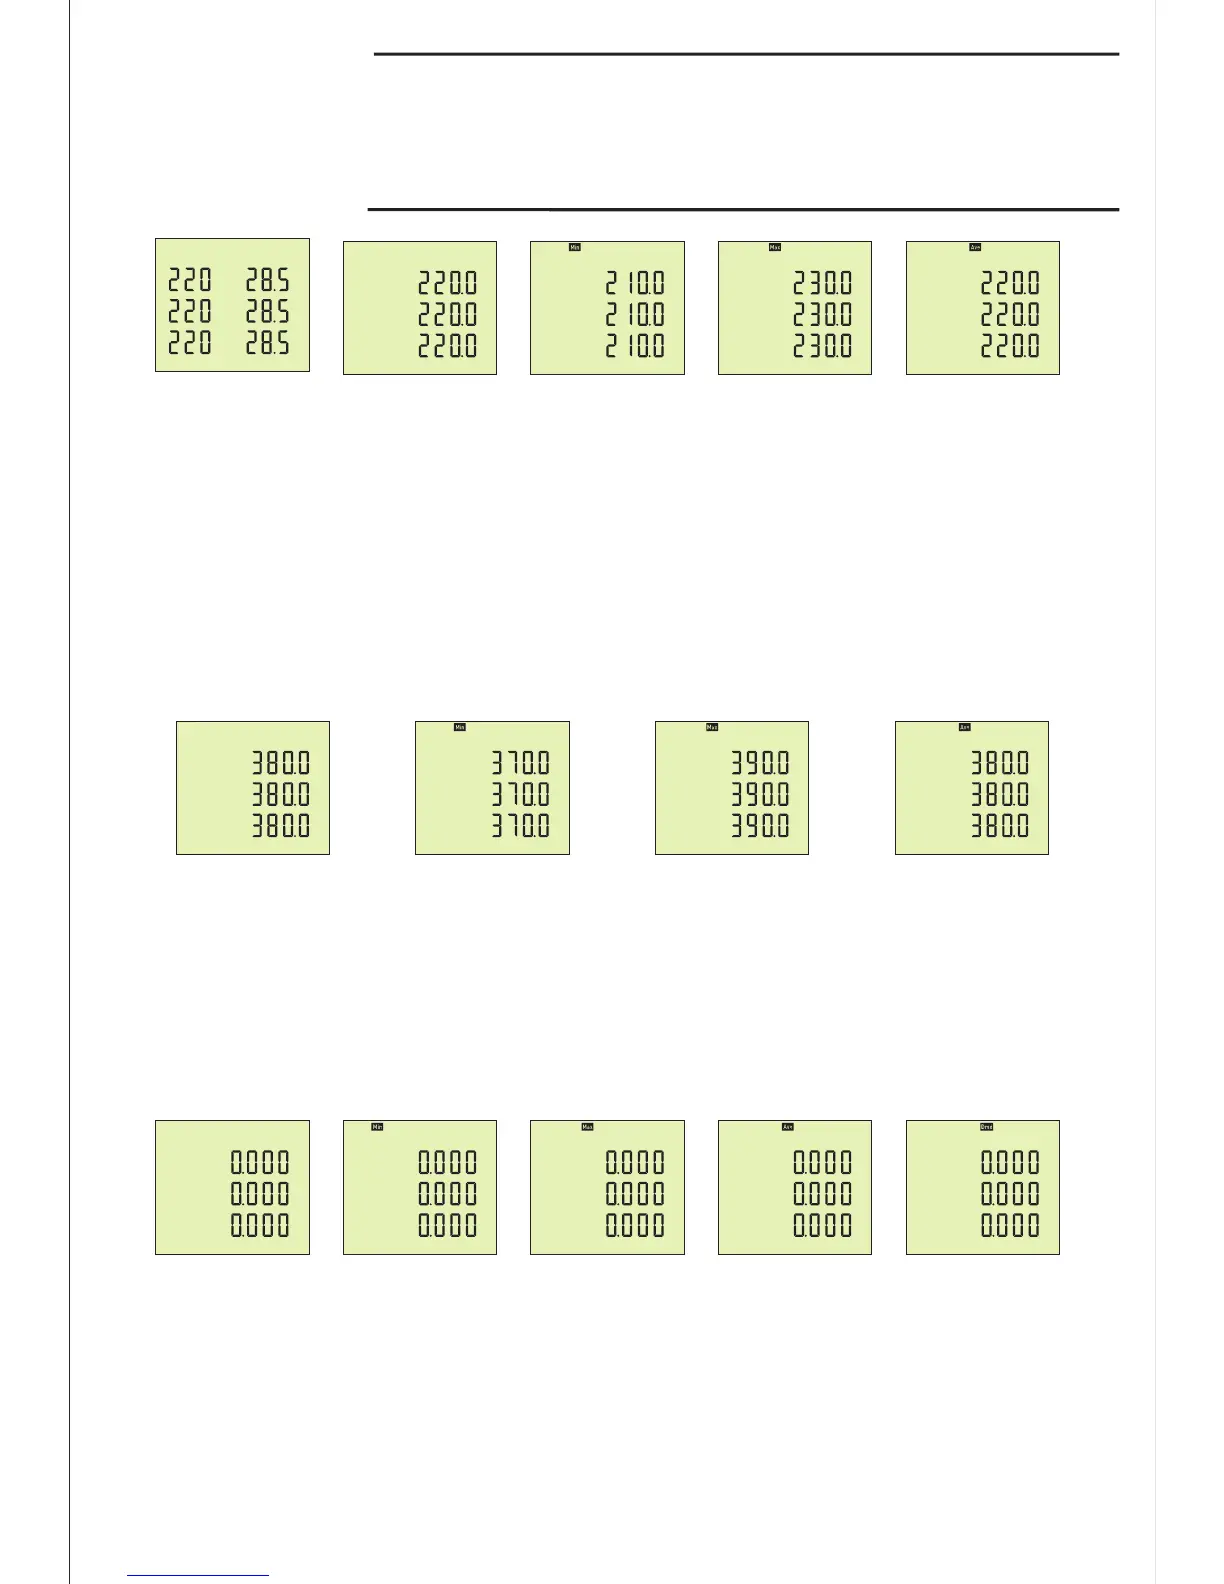
Home Screen: It shows voltage and current values together. If you use voltage transformer, it is not
showed. The figure-3 is displayed when you press the Down button.
Figure-3: It shows the phase-neutral voltage values. The figure-4 is displayed when you press the
Down button.
Figure-4: It shows the phase-neutral minimum voltage values. The figure-5 is displayed when you press
the Down button.
Figure-5: It shows the phase-neutral maximum voltage values. The figure-6 is displayed when you press
the Down button.
Figure-6: It shows the phase-neutral mean voltage values. The figure-7 is displayed when you press the
Down button.
Figure-7: It shows the phase- phase voltage values. The figure-8 is displayed when you press the Down
button.
Figure-8: It shows the phase- phase minimum voltage values. The figure-9 is displayed when you press
the Down button.
Figure-9: It shows the phase- phase maximum voltage values. The figure-10 is displayed when you press
the Down button.
Figure-10: It shows the phase- phase mean voltage values. The figure-11 is displayed when you press the
Down button.
9- Display Information:
Figure-7
L12
L23
L31
V
V
V
V
Figure-8
L12
L23
L31
V
V
V
V
Figure-9
L12
L23
L31
V
V
V
V
Figure-10
L12
L23
L31
V
V
V
V
-4-
Figure-3
L1
L2
L3
V
V
V
V
Figure-4
L1
L2
L3
V
V
V
V
Figure-5
L1
L2
L3
V
V
V
V
Figurel-6
L1
L2
L3
V
V
V
V
L1
L2
L3
V
A
A
A
I
Home Screen
Figure-11: It shows the current values of each phase. The figure-12 is displayed when you press the
Down button.
Figure-12: It shows the minimum current values of each phase. The figure-13 is displayed when you
press the Down button.
Figure-13: It shows the maximum current values of each phase. The figure-14 is displayed when you
press the Down button.
Figure-14: It shows the mean current values of each phase. The figure-15 is displayed when you press
the Down button.
Figure-15: It shows the current demand current values of each phase. The figure-16 is displayed when
you press the Down button.
L1
L2
L3
I
A
A
A
Figure-11
L1
L2
L3
I
A
A
A
Figure-13
L1
L2
L3
I
A
A
A
Figure-15
L1
L2
L3
I
A
A
A
Figure-14
L1
L2
L3
I
A
A
A
Figure-12