10 / 19
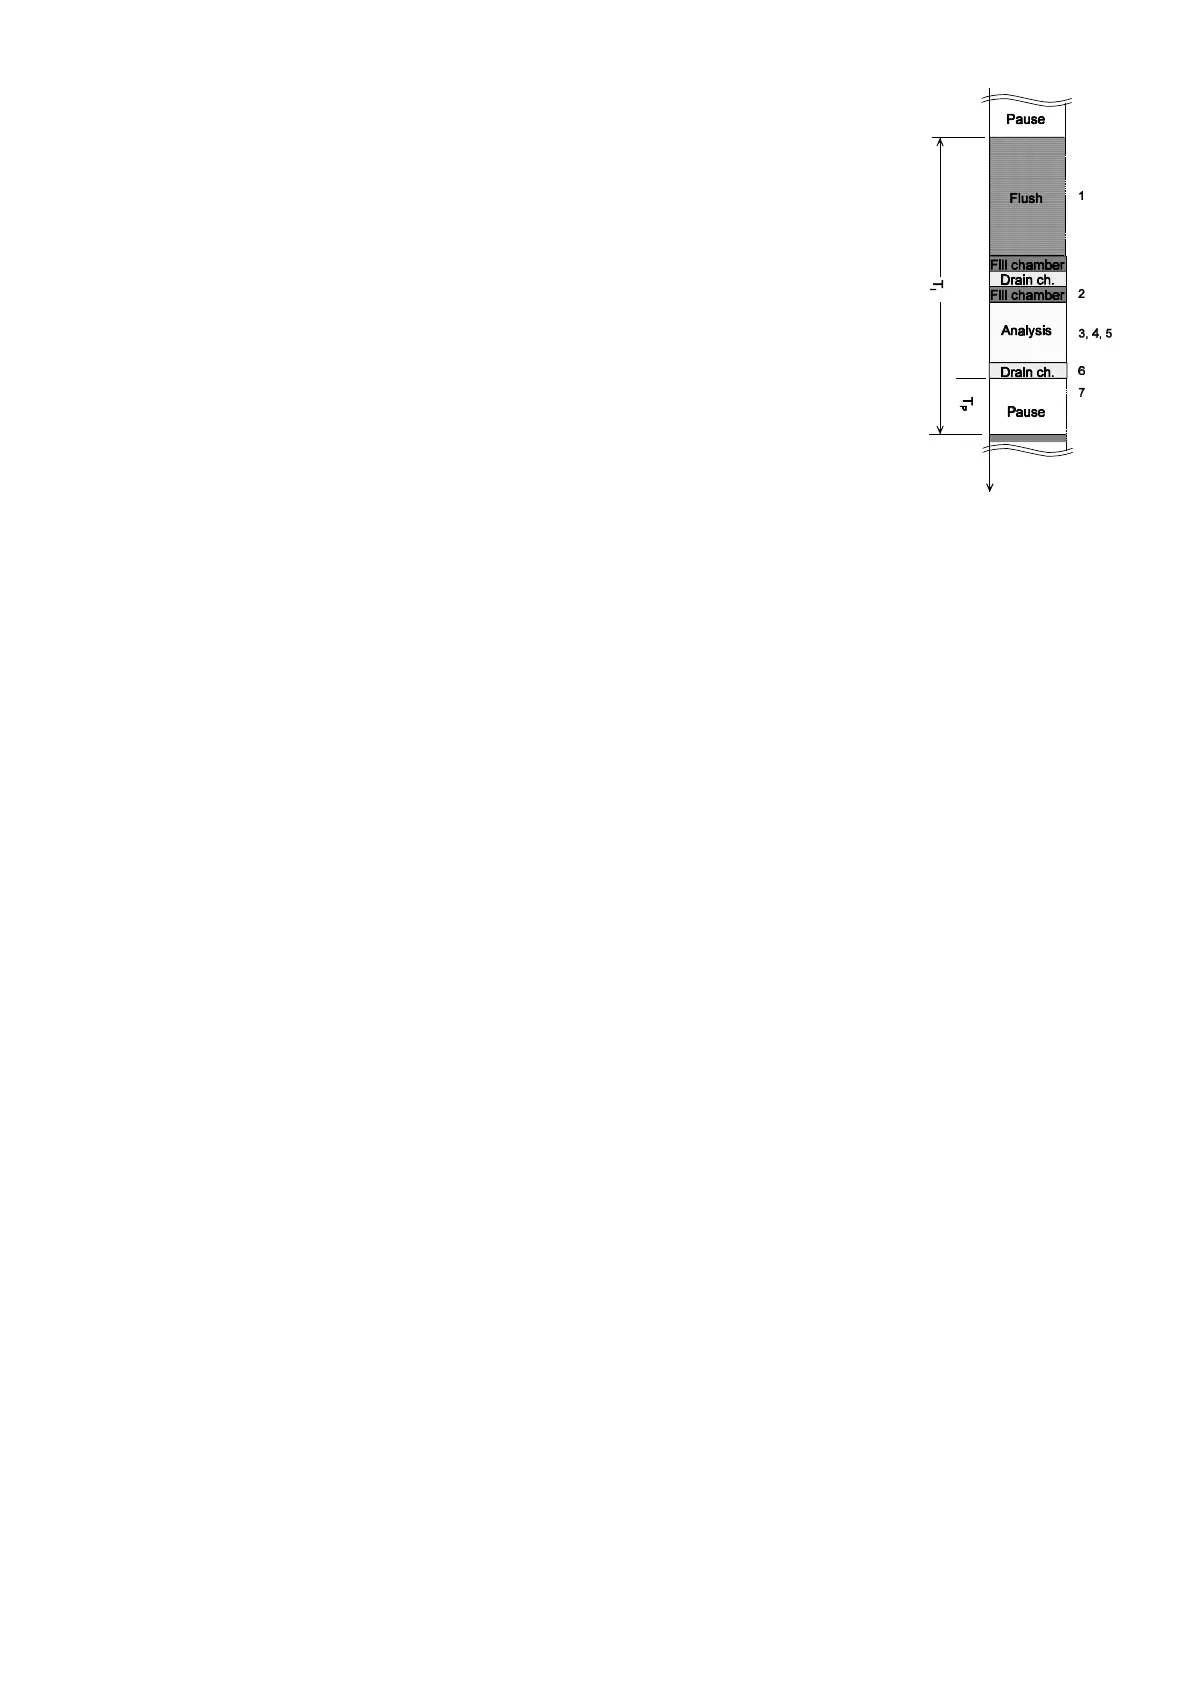
Analysis cycle (Example with schematic cycle diagram)
1 Flush branch line and measuring chamber (note flush time of the sampling line)
2 Fill measuring chamber
3, 4 Check the sample for dirtiness, dosing reagent (stirring mechanism is "ON")
5 Evaluate and display reaction
6 Drain measuring chamber
7 Pause period up to the next analysis (time or quantity analysis interval), Tp.
T
I
= total analysis interval, ch = measuring chamber
Displayed unit
Programmed hardness unit is displayed. You have the choice of °dH, °f, ppm CaCO
3
and
mmol/l. The unit entered will now be displayed as programmed.
Type of reagent
Select the reagent type you are utilising in the unit, e. g. reagent TH 2005 means 8.93 ppm CaCO
3
upper limit of the
measuring range and 0.89 ppm CaCO
3
lower.
Setting the timer
Flush
In order to ensure the analysed sample represents the current value, the sampling tube must be sufficiently well flushed
taking its length into consideration. After the installation has been out of operation for a longer period or in the case of
long analysis intervals, it is sensible to select a flushing time in excess of 60 seconds. Flush is initiated by
simultaneously opening the Testomat
®
ECO’s inlet and the outlet valves.
L The analysis interval directly depends on the programmed flush time. If a flush time of, for example, 90 seconds is
set, the analysis interval itself cannot be shorter than 90 seconds.
Example: For 3 bar pressure, a connection longer than 5 m, an internal tube diameter of 4 mm, and a minimal
internal flushing time of 10 seconds is required to ensure a valid sample is taken from the sampling tube.
The quantity of flush water for an internal flush of 1 minute is 0.5 litre.
Interval pause
In the case of timed triggering of the analysis, the interval between two analyses (plus flush time) is determined by the
interval pause. The shortest interval can be 0 minute. In this case, the analyses are carried out continuously. The
longest interval is 99 minutes.
Monitoring of limit value
Two outputs for the limit value are available for monitoring. You can program the limit value on a continuous scale. The
range for the limit value depends on the reagent type used and on the programmed unit. The functions of these outputs
can be programmed independently from each other.
When the limit value LV1 is exceeded, limit value control display lights up LV1 RED and the relay output LV1 reacts as
programmed in the switch function. As long as this limit value is not exceeded, the display lights up GREEN.
The unit operates in the same way for the limit value LV2.