TIp 5: Adjusting the Viewing Window
Fundamental Topics in Science © 2001 Texas Instruments
TIp 5-4
Try-It!
Ë
on Your TI
83 Plus
(continued)
Using ZDecimal—the Friendly Window
•
Display and trace the graph
Y
2
=2x
, using
ZDecimal
window values.
ZDecimal
lets you trace
the
X
values by tenths (.1, .2, .3, …).
•
Multiply
Xmin
,
Xmax
,
Xscl
,
Ymin
,
Ymax,
and
Yscl
by 100 in the window menu, and trace the
function. This lets you trace the
X
values by tens.
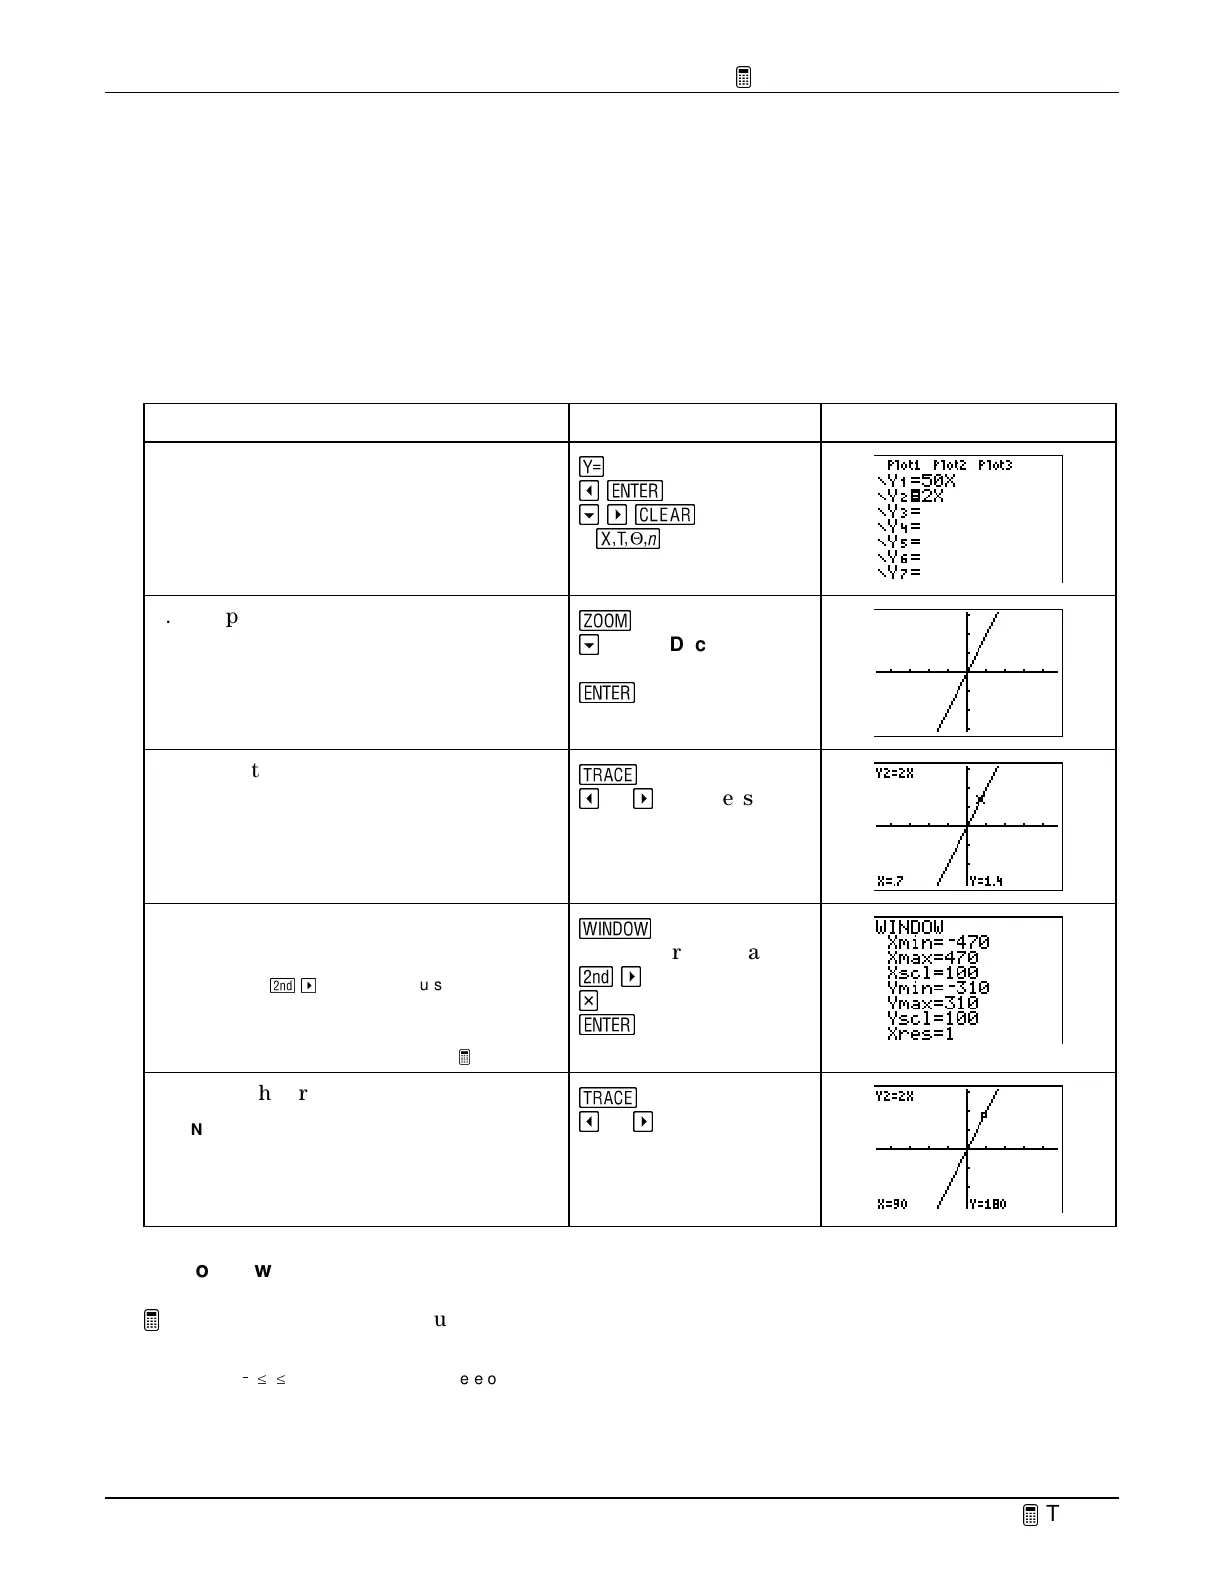
To Do This Press Display
1. Turn off the graph and table of
Y
1
=50X
and enter
Y
2
=2x
in the
Y= editor.
&
!
¯
#
"
s
2
f
2. Graph
Y
2
=
2x
using
ZDecimal
window
values.
(
#
until
ZDecimal
is
highlighted
¯
3. Trace the graph.
Note:
Notice that the window is set up so that the
X
values are tracing by tenths.
)
!
or
"
as necessary
4. Multiply
Xmin, Xmax
,
Xscl
,
Ymin
,
Ymax
, and
Yscl
by 100.
Tip:
Press
-
"
to move the cursor to the end of
a window setting line.
Note:
See the calculator guidebook for details
about
Xres
. It is not discussed in this
TIp.
S
Repeat for each value:
-
"
M
100
¯
5. Trace the graph.
Note:
Notice that the window is set up so that the
X
values are tracing by tens.
)
!
or
"
as necessary
On Your Own
Graph
Y
1
=.1X
. How can you set an appropriate viewing window for this graph?
Hint
: Make a table of values for
Y
1
=.1X
and use the table information to change the window values. Try finding the best values to
choose when
/
5
c
X
c
5. If
X=5
,
Y=.1(5)
=
.5
. Therefore, the
Y
values need to be very small. Try changing
Ymin
,
Ymax
, and
Yscl
.
 Loading...


