Getting Started with the TI-84 Plus C Silver Edition 33
3. Press Í. The variable contents are inserted where the cursor was
located before you began these steps.
Note: You can edit the characters pasted to the expression without
affecting the value in memory.
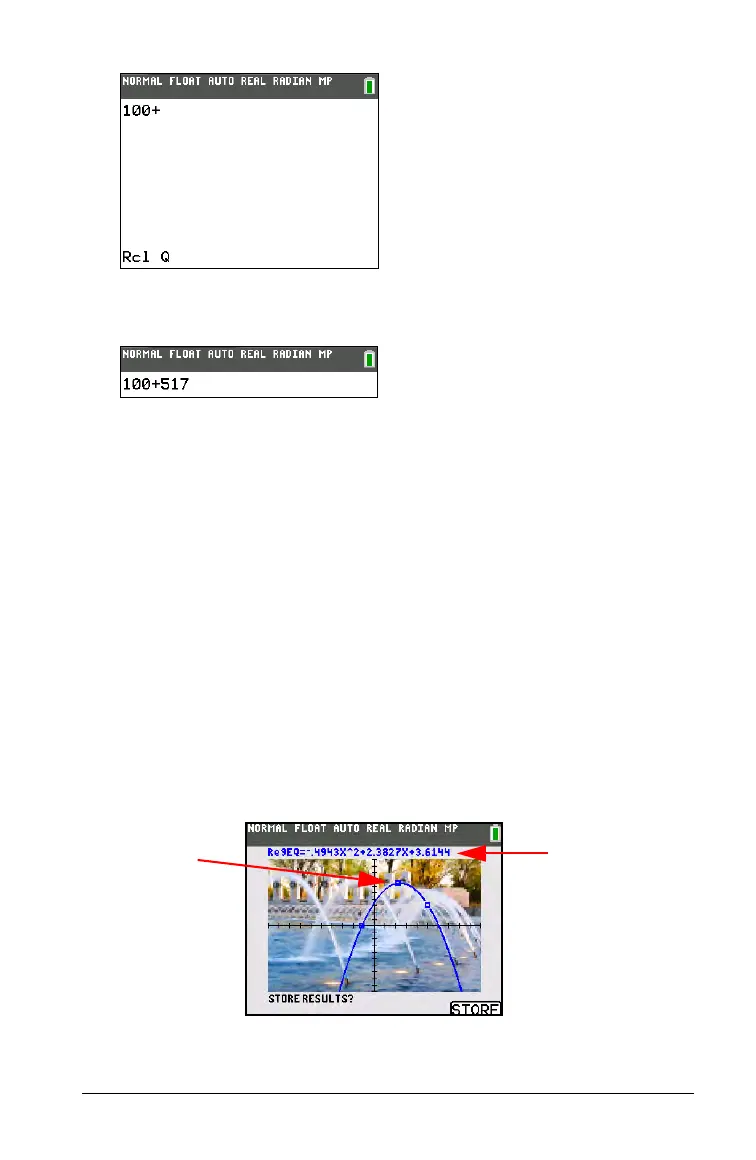
QuickPlot and Fit Equation
QuickPlot and Fit Equation allows you to drop points on a graph screen
and model a curve to those points using regression functions. You can
select color and line style, draw points on a graph, and choose an
equation to fit the drawn points. You can then store the results of the
plot and equation. For details, refer to Chapter 12 in the guidebook.
QuickPlot and Fit Equation is an option in the … / menu.
Prior to starting the QuickPlot
and Fit Equation interactive feature on the
graph area, be sure to set your Background Image Var and other graph
settings from the FORMAT screen. Also set your WINDOW or ZOOM
settings.
Drop points
on the
screen.
Points can be
saved to lists.
Calculate the
regression
equation, draw
the curve, and
store the
function.