14Thermostat User Guide
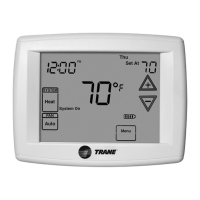
Usage Graph
The Usage Graph shows daily heating and cooling runtime hours for a week.
Heating time (Hrs)
Done Cool
20
15
10
5
Sun Mon Tue Wed Thu Fri Sat
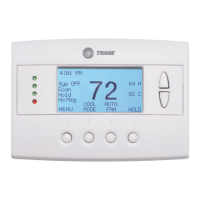
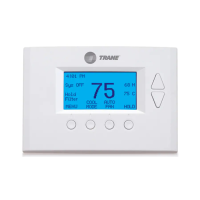
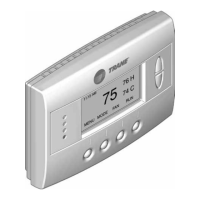
The button in the lower right corner will change depending on what is being displayed. When the heating time is displayed,
the button will read Cool. When the cooling time is displayed, the button will read Heat. Press the Heat/Cool button to
display the heating/cooling time.

 Loading...