Instrument Operation 4-3
the control knob. The top bar on the Main Data Presentation Screen
shows instrument status and current time. The second line shows
the status of the Flash Memory Card (Ready, Removed, or Logging)
and the inlet sample flow setting (high or low flow).
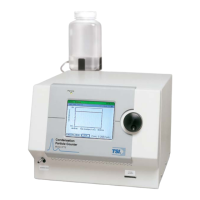
The Main Data Presentation Screen shows a graph of the number
concentration, in particles per cubic centimeter (p/cc) versus time,
and presents real-time number concentration at the lower right
corner of the display. A menu of three primary instrument
functions (CURSOR, MENU, and START/STOP) are presented at the
bottom of the screen.
Figure 4-2
CPC Main Data Presentation Screen During Operation
Primary Functions in the Main Data Presentation
Screen
Primary functions are accessed directly through the use of the
control knob by highlighting a function and pressing the knob
inward to select. A highlighted function will have a blue box
surrounding the text. The display in
Figure 4-2 has the STOP
function highlighted for example.
Number concentration data is presented graphically in real time
once the START button is selected. When START is selected, the
function label changes to STOP as shown in
Figure 4-2. Depressing
the knob again stops the graph from updating, and START
reappears. The display is updated once per data average period.
Figure 4-2 shows a concentration of approximately 2 × 10
4
p/cc.
The graph was updated each second over an interval of 24 seconds.
Note: For the 3775, the maximum concentration displayed is 10
7
particles/cm
3
. At concentrations above 10
7
particles/cm
3
,
particle concentration data and the top status bar on the front

 Loading...