UTD2000 Series User Manual
39
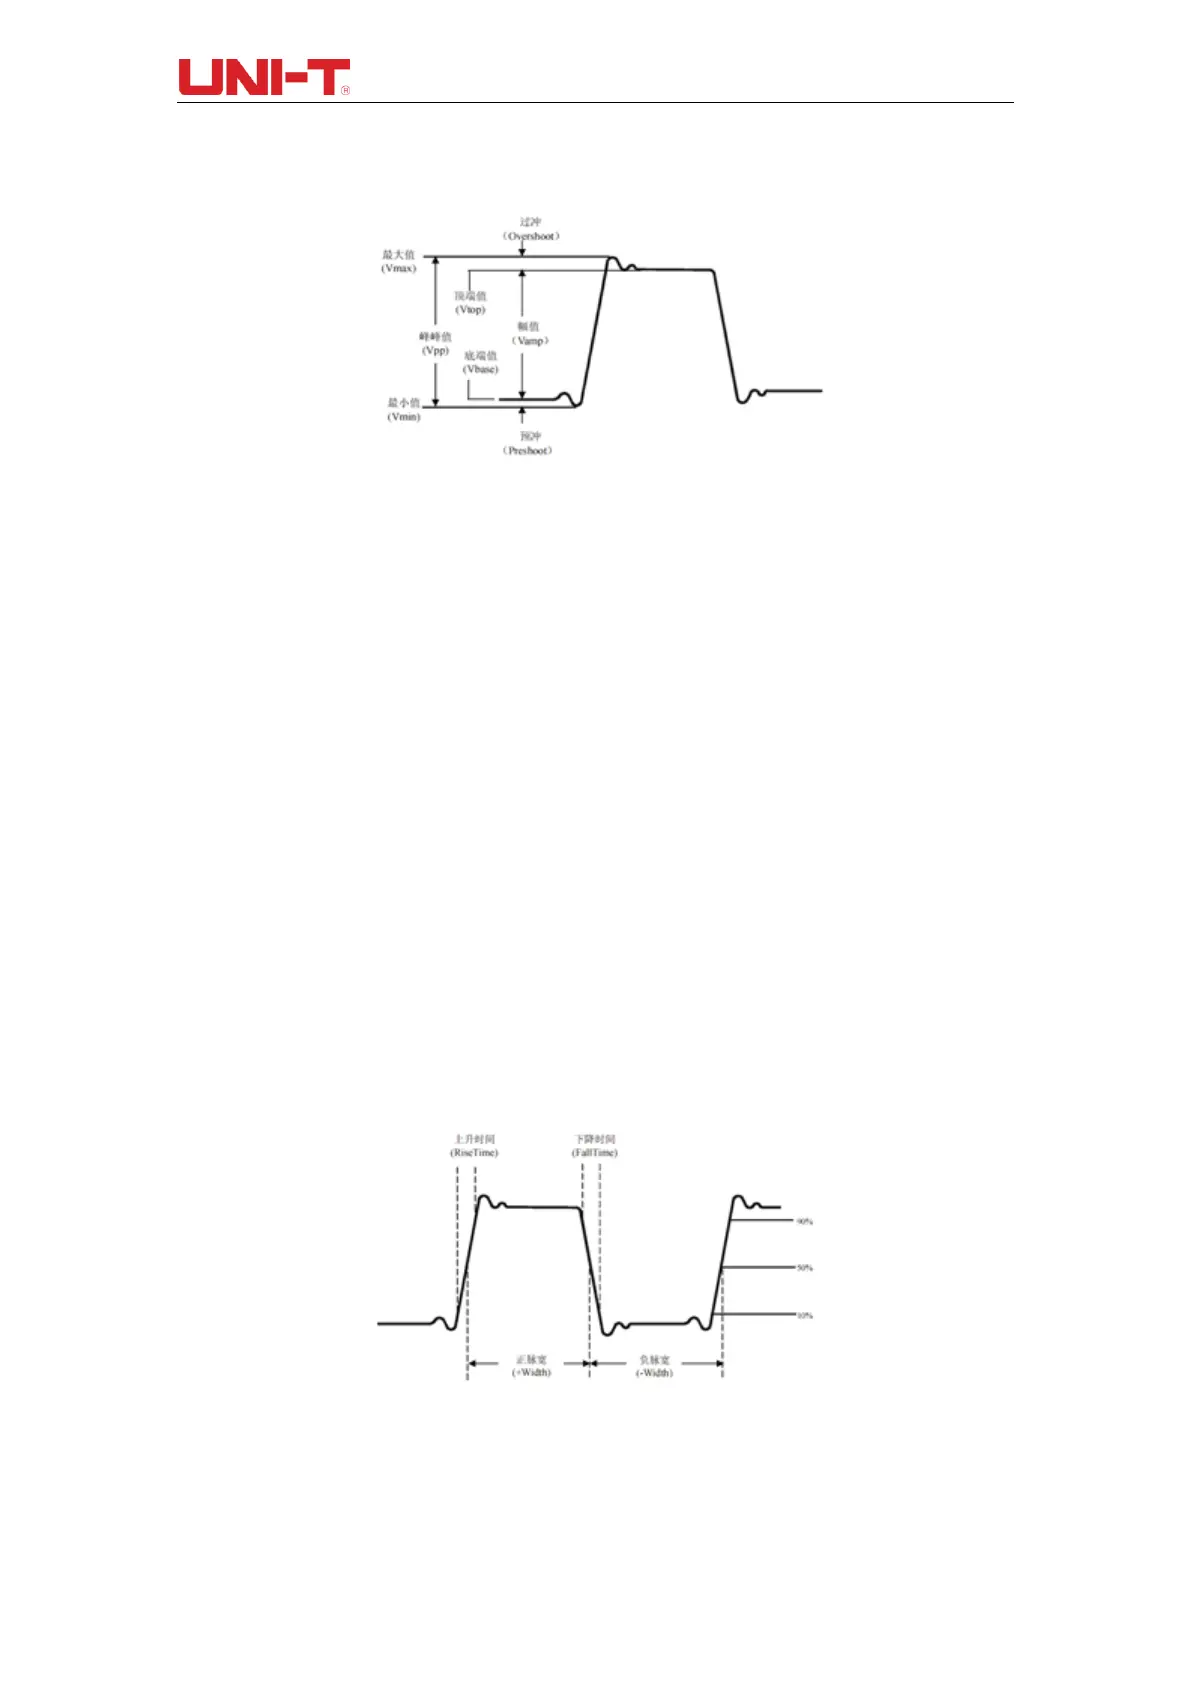
7.2 Voltage Parameter
Figure 7-2 Voltage Parameter Diagram
Voltage parameters of UTD2000 series DSO include:
Max value (Max): The voltage value from waveform highest level to GND.
Min value (Min): The voltage value from waveform lowest level to GND.
Top value (High): The voltage value from waveform flat top to GND.
Bottom value (Low): The voltage value from waveform bottom to GND.
Middle value (Middle): Half of the sum value of High and Low voltage value.
Peak-peak value (Pk-Pk): The voltage value from waveform highest level to waveform
lowest level.
Amplitude (Amp): The voltage value from waveform top to waveform bottom.
Mean value (Mean): The average amplitude value of waveform.
Cycle mean (CycMean): The average amplitude value of waveform of one cycle.
Root Mean Square (RMS): The effective value. The converted energy based on AC signal.
The DC voltage corresponding to the generating equivalent energy, converted energy.
Cycle RMS (CycRMS): The converted energy in one cycle based on AC signal. The DC
voltage corresponding to the generating equivalent energy.
7.3 Time parameter
Figure 7-3 Timing Parameter Diagram
Timing parameters of UTD2000 series DSO include:
Period (Period): The time between two consecutive and same-polarity edges of repetitive
waveform.