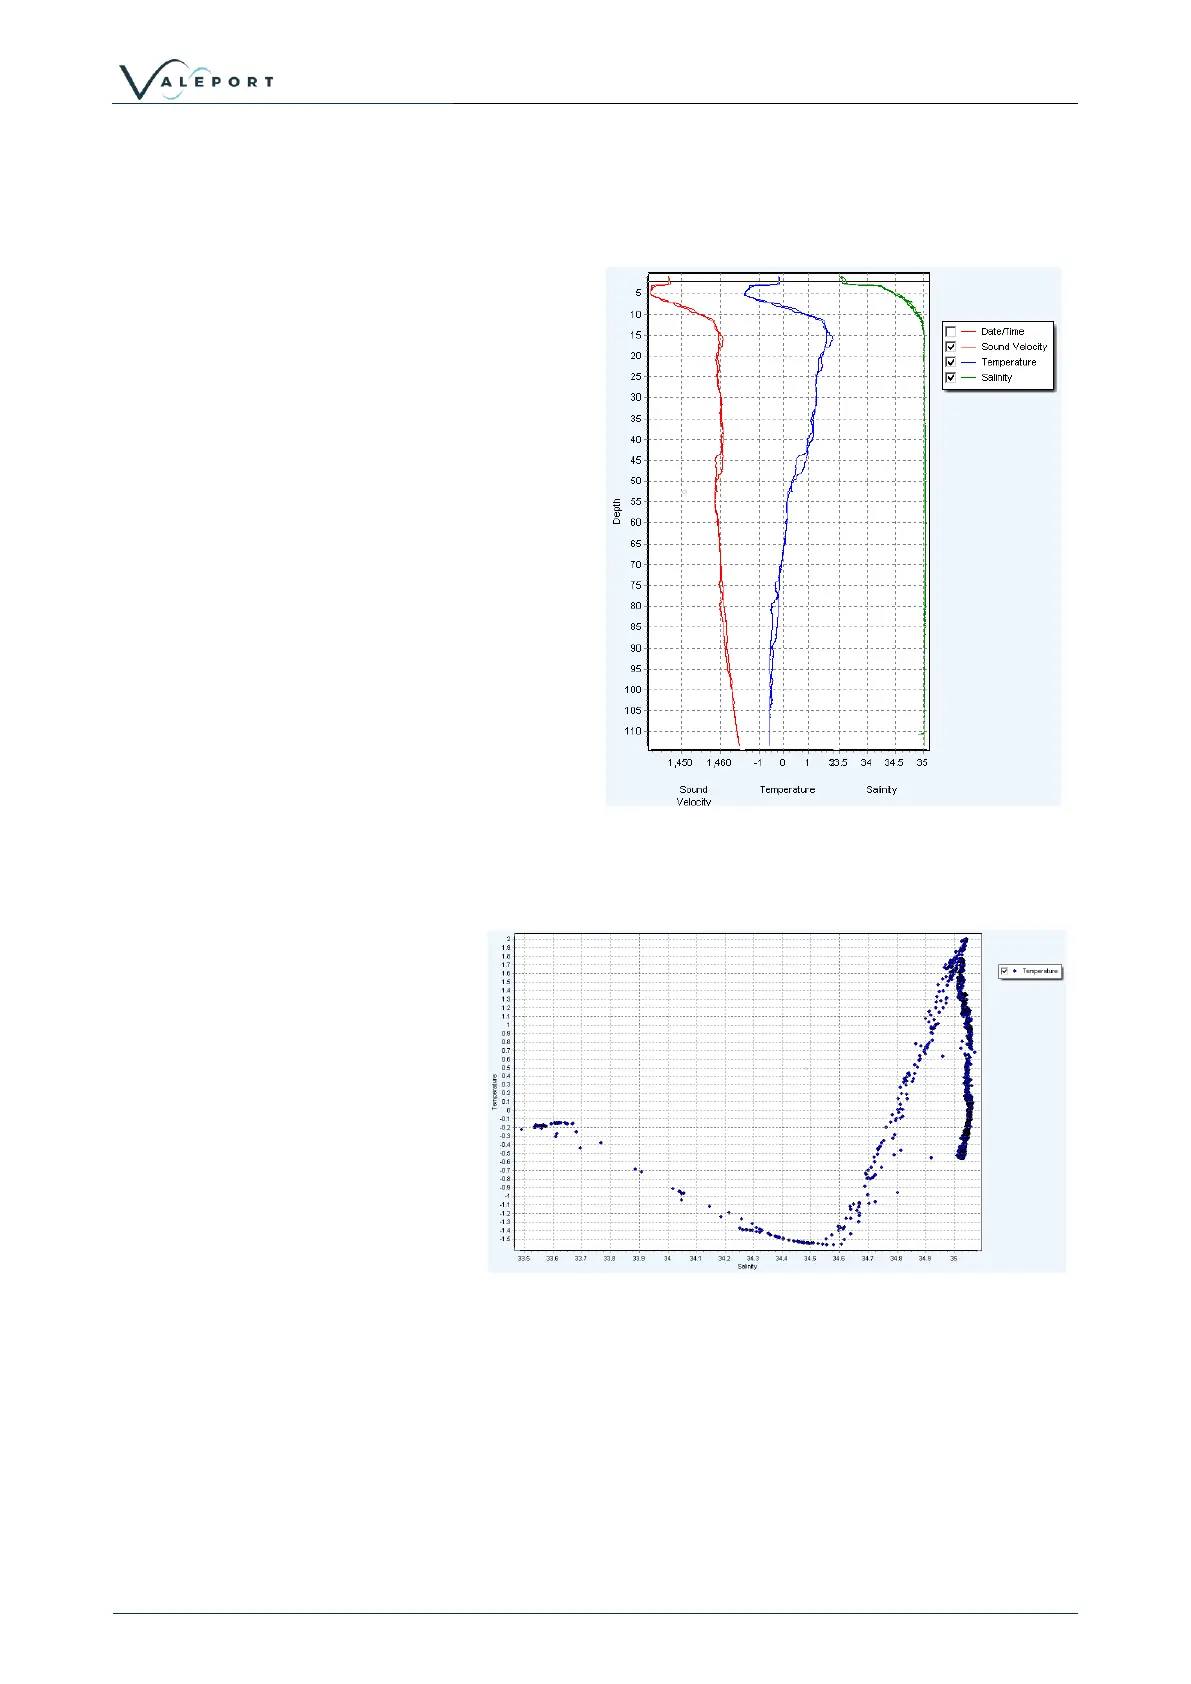
A profile chart can show a single or multiple
parameters plotted against depth/pressure.
Depth/Pressure is always on a reversed Y
axis.
A scatter chart allows one
parameter to be plotted against
another. A good example of this is
T-S plot traditionally used in
oceanography to identify water
masses.
Temperature is show here on the
Y axis with Salinity plotted on the
X axis.
4.1.5 Polar Chart
Polar Charts can be used to display vector type data with a magnitude + direction. eg. water
current direction and speed or wind speed and direction.
 Loading...