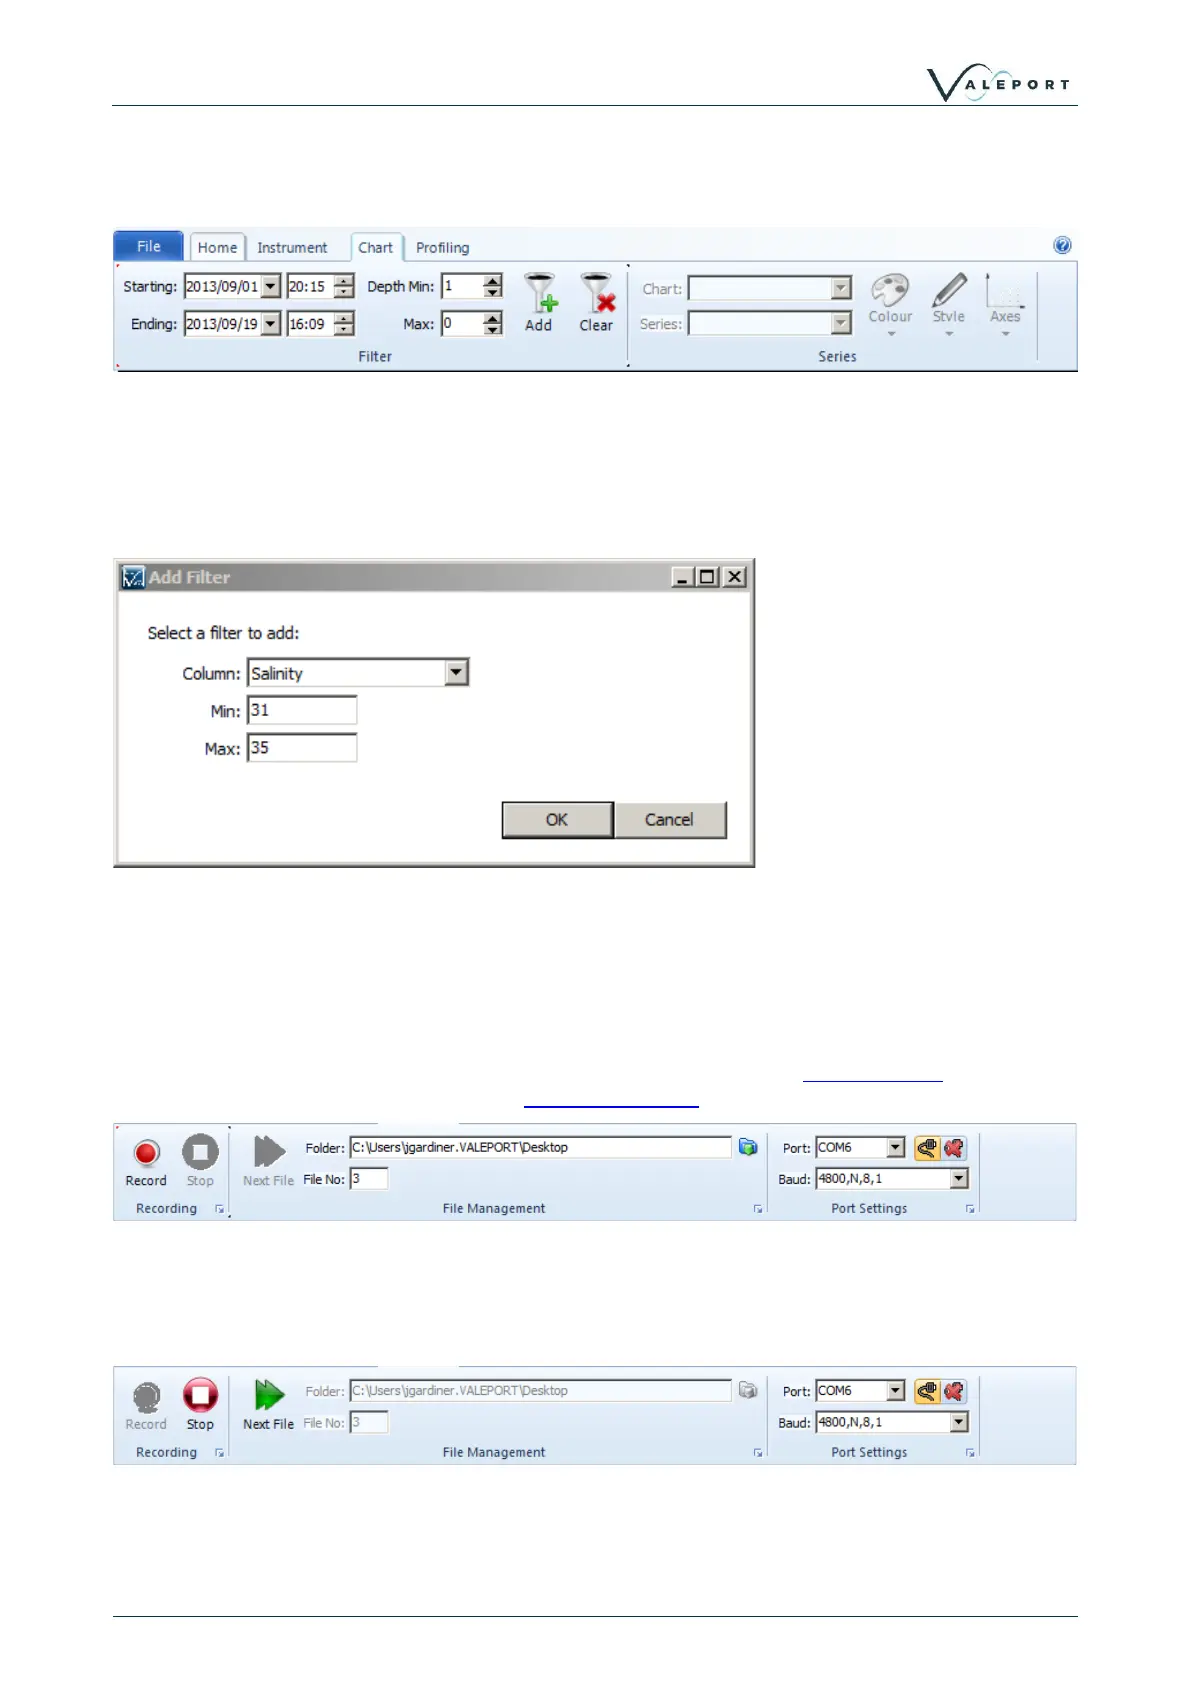
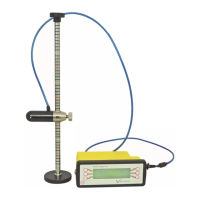
4.3 Chart ToolBar
The Chart Toolbar allows for some basic filtering to be applied to the datasets in the workspace.
Date and Depth filters can be applied using the toolbar buttons, One additional filter can be added
using the Add button. This brings up the filter dialogue where the parameter to filter with can be
selected and upper/lower limits set.
To clear the filter, click the clear button.
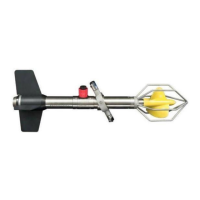
4.4 Recording Toolbar
The Recording toolbar becomes active when the Record button on the Home Toolbar is clicked.
Clicking the record button will activate the Recording Wizard.
The recording toolbar can be used to manage incoming data. The toolbar informs on the location
that files are being saved to, the file increment and the port settings of the attached instrument.
When DataLog X2 is actively recording data, a new file can be started by pressing the next file
button.
This is will also have the effect of resetting any graphs or charts currently active.