29
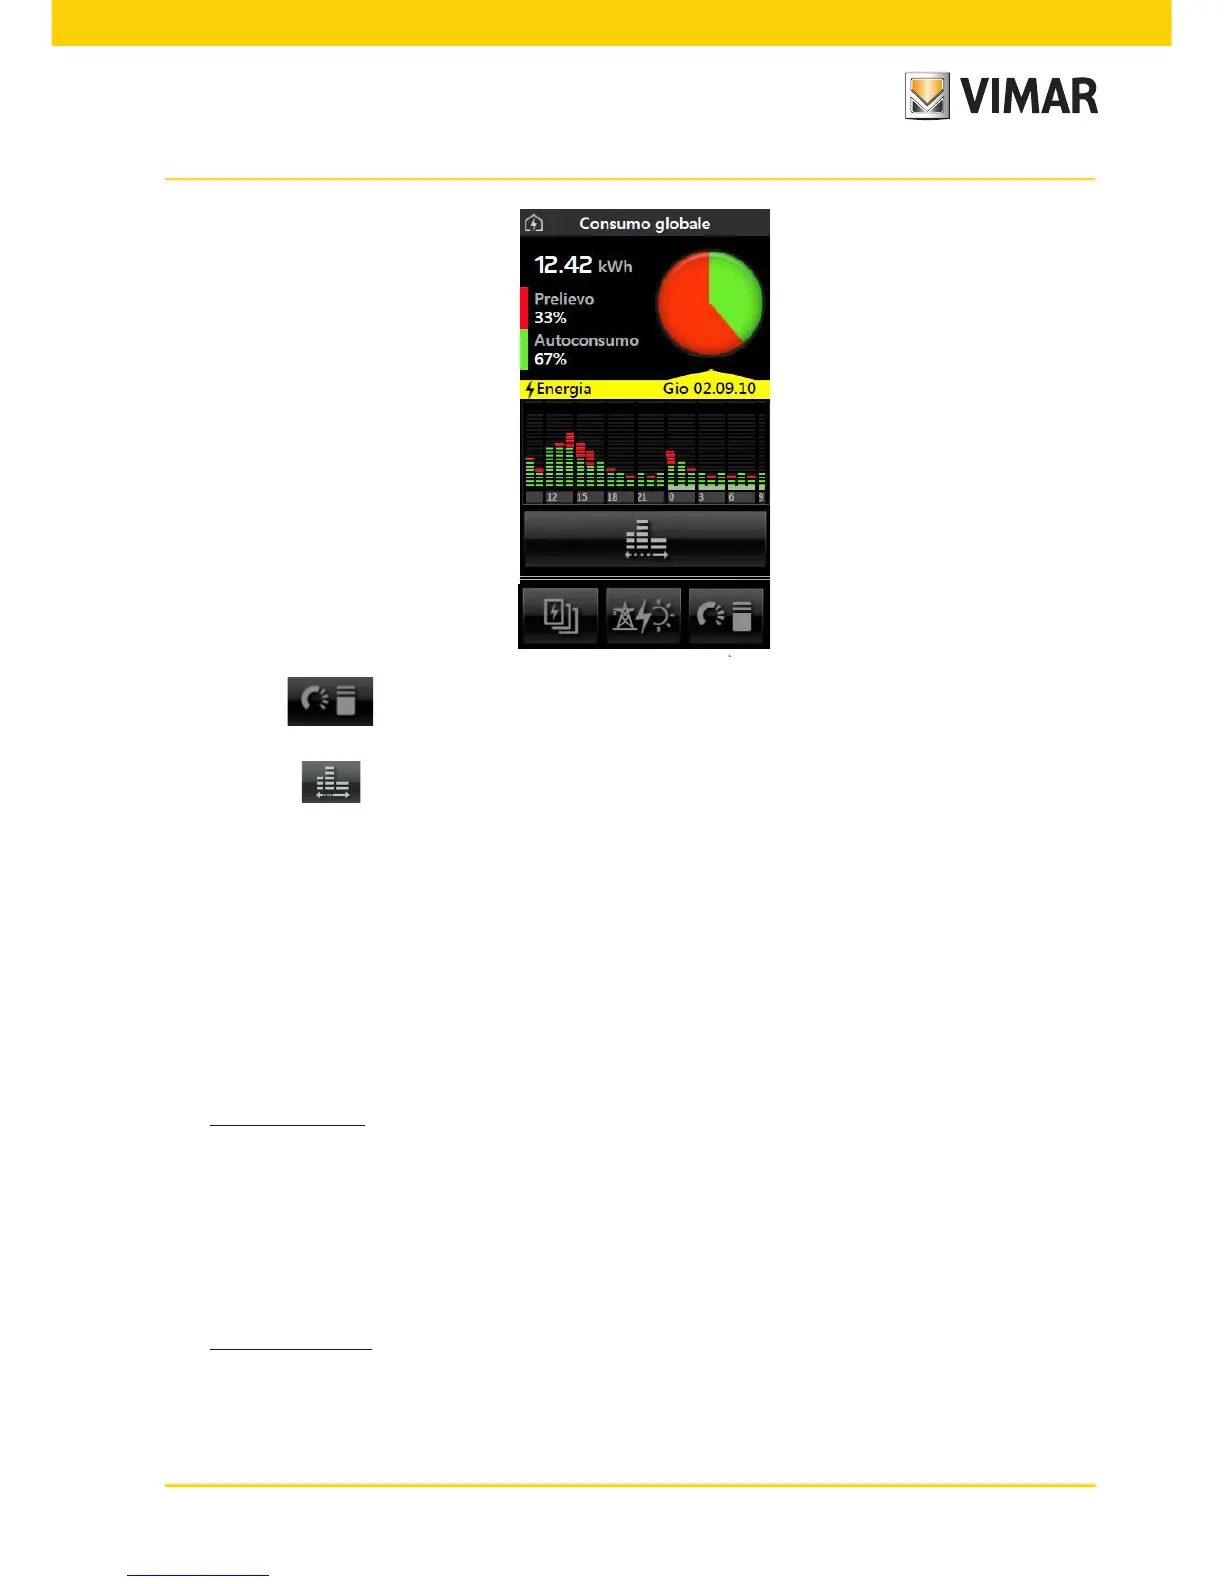
• Tapping the icon again displays the screen for Global consumption given at the beginning of the
page.
• By tapping the icon you can set the time scale (hours, days, weeks, months) for measuring the consumption.
The quantitative consumption displayed is:
- daily if the time scale set for the consumption histogram is in hours;
- weekly if the time scale set for the consumption histogram is in days;
- monthly if the time scale set for the consumption histogram is in weeks;
- yearly if the time scale set for the consumption histogram is in months.
The parts of the histogram highlighted at the bottom by a white line represent the values displayed in the quantita-
tive consumption icon.
■ CONSUMPTION HISTOGRAM
The graphic representation of the consumption histogram varies depending on the type of contract made.
Time slot contract
- Average consumption: displayed in grey
- Actual consumption: displayed in green.
To represent the three possible time slots, different shades of green are used going from pale green for slot
1 to dark green for slot 3.
If the average consumption is exceeded, the histogram bar will turn yellow.
- If the set time scale is in hours, at the top left of the histogram a number is displayed that indicates the time slot.
Threshold contract
- Average consumption: displayed in grey.
This value represents the threshold of the expected consumption.
- Actual consumption: displayed in green (single shade).
The bar of the histogram turns yellow if the threshold is exceeded.
Energy monitoring