31
Energy monitoring
• The icon is used to clear the data displayed on the screen.
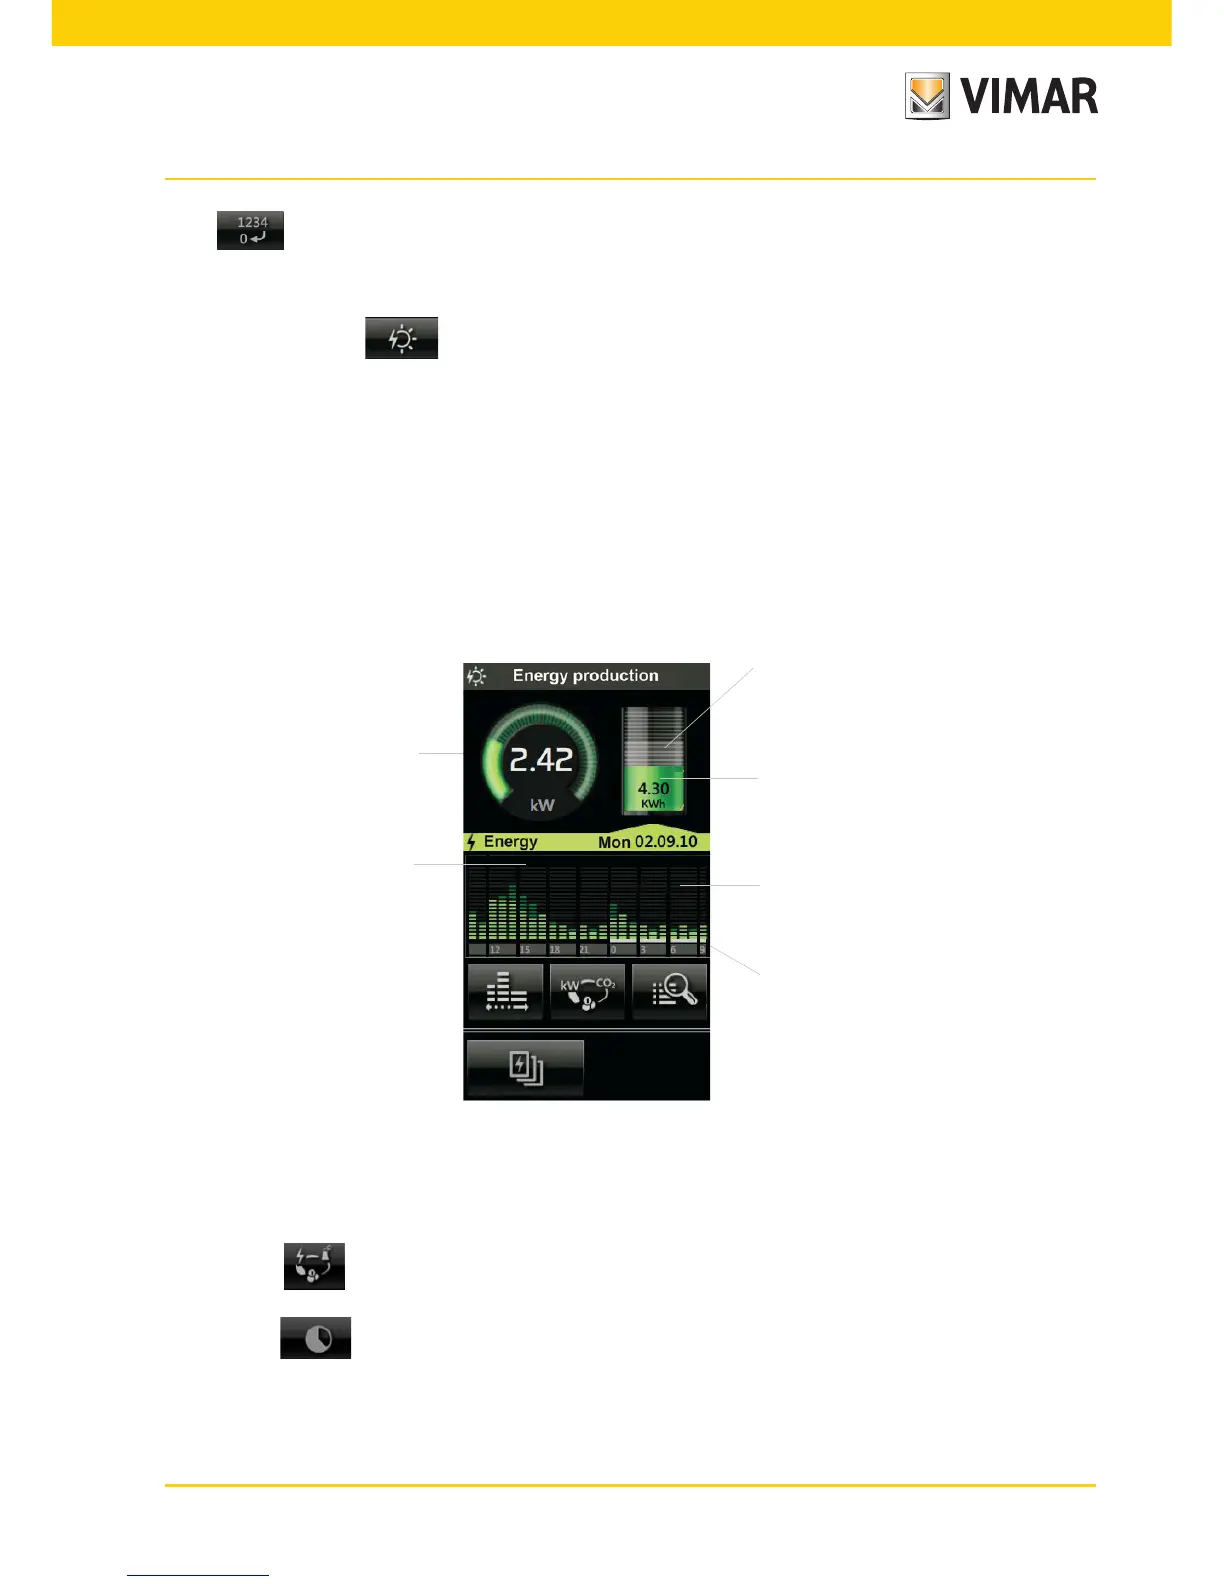
6.3 ENERGY PRODUCTION
When present, tapping brings up the screen for viewing and managing the energy production of the
house with:
- an indication of the instantaneous power generated in kW or CO
2
or cost in euro;
- an indication of the accumulated energy generated in kW/h or CO
2
or cost in euro;
- a bar chart of the accumulated energy generated in kW/h or CO
2
or cost in euro subdivided by day/week/
month/year.
Dark green indicates the energy produced and light green indicates the auto-consumption.
N.B. Obviously, the value represented by light green will never be greater than that represented by dark green (at
most they can be equivalent).
Instantaneous production
Current quantitative production
Average quantitative production
Histogram of the
accumulated energy
Indication of average
production
Values displayed in the production
quantity icon
Dynamic Mode: Pressing the area that displays the instantaneous power for 2 min after the reading of the
will value every 2 s thus increasing the frequency of update of the data represented. At the end of 2 min, the
reading will repeat every 30 seconds until an eventual new pressure.
• Tapping the icon displays, sequentially and in a loop, the data for energy consumption (in kWh), emis-
sions of greenhouse gases (if this feature has been enabled by the installer) and costs.
• Tapping the icon displays another screen that, by means of a pie chart and a series of histograms, indi-
cates the percentage of fed-in energy and self-consumed energy of the total represented by the energy produced.