32
Energy monitoring
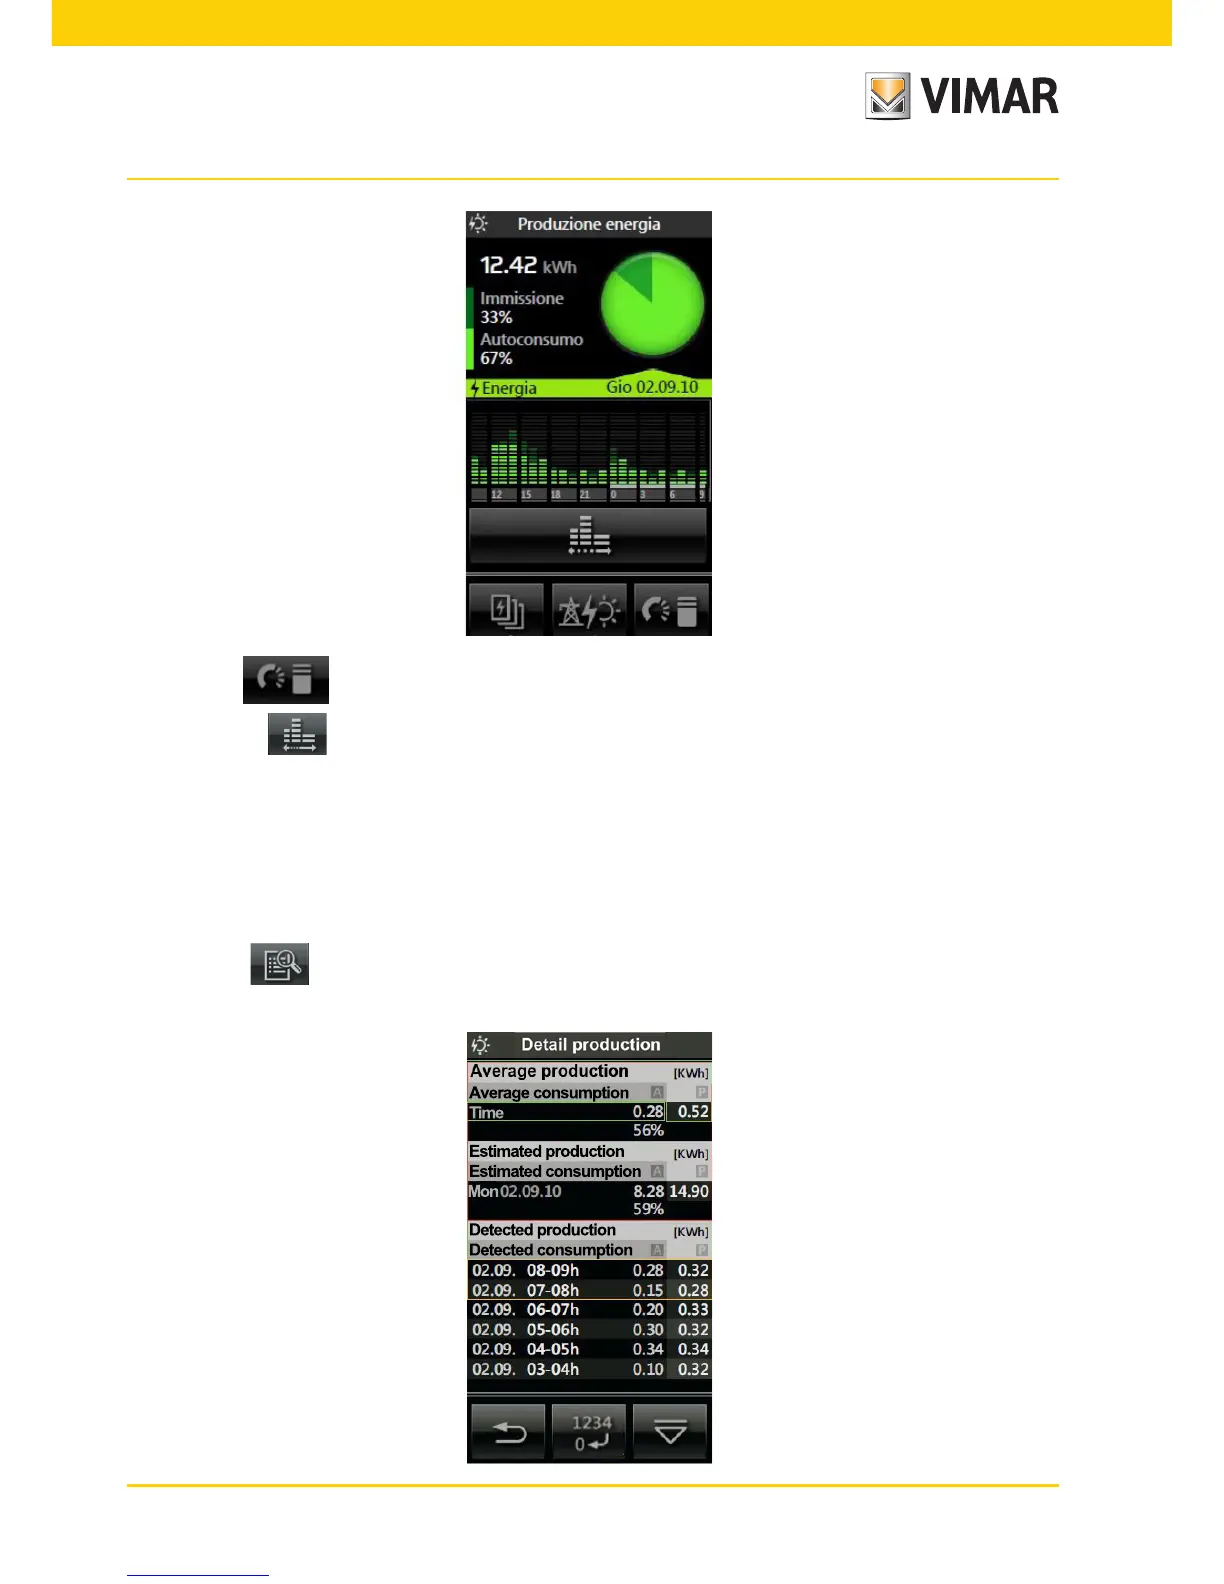
• Tapping the icon again displays the screen for Energy production given at the beginning of the page.
• By tapping the icon you can change the reference time interval (daily, weekly, monthly and yearly) for the
bar chart of the production log.
The quantitative production displayed is:
- daily if the time scale set for the histogram is in hours;
- weekly if the time scale set for the histogram is in days;
- monthly if the time scale set for the histogram is in weeks;
- yearly if the time scale set for the histogram is in months.
• Tapping the icon displays the detailed production screens according to the set unit of measurement
and time scale.