33
Energy monitoring
The screens detailing the production of energy show:
- the average production, average hourly (or daily/weekly/monthly) auto-consumption in kW/h and the percentage
ratio of the former to the latter;
- the daily (or weekly/monthly/yearly) estimated production and auto-consumption in kW/h and the percentage
ratio of the former to the latter;
- the hourly (or daily/weekly/monthly) production and auto-consumption in kW/h,
• The icon is used to clear the data displayed on the screen.
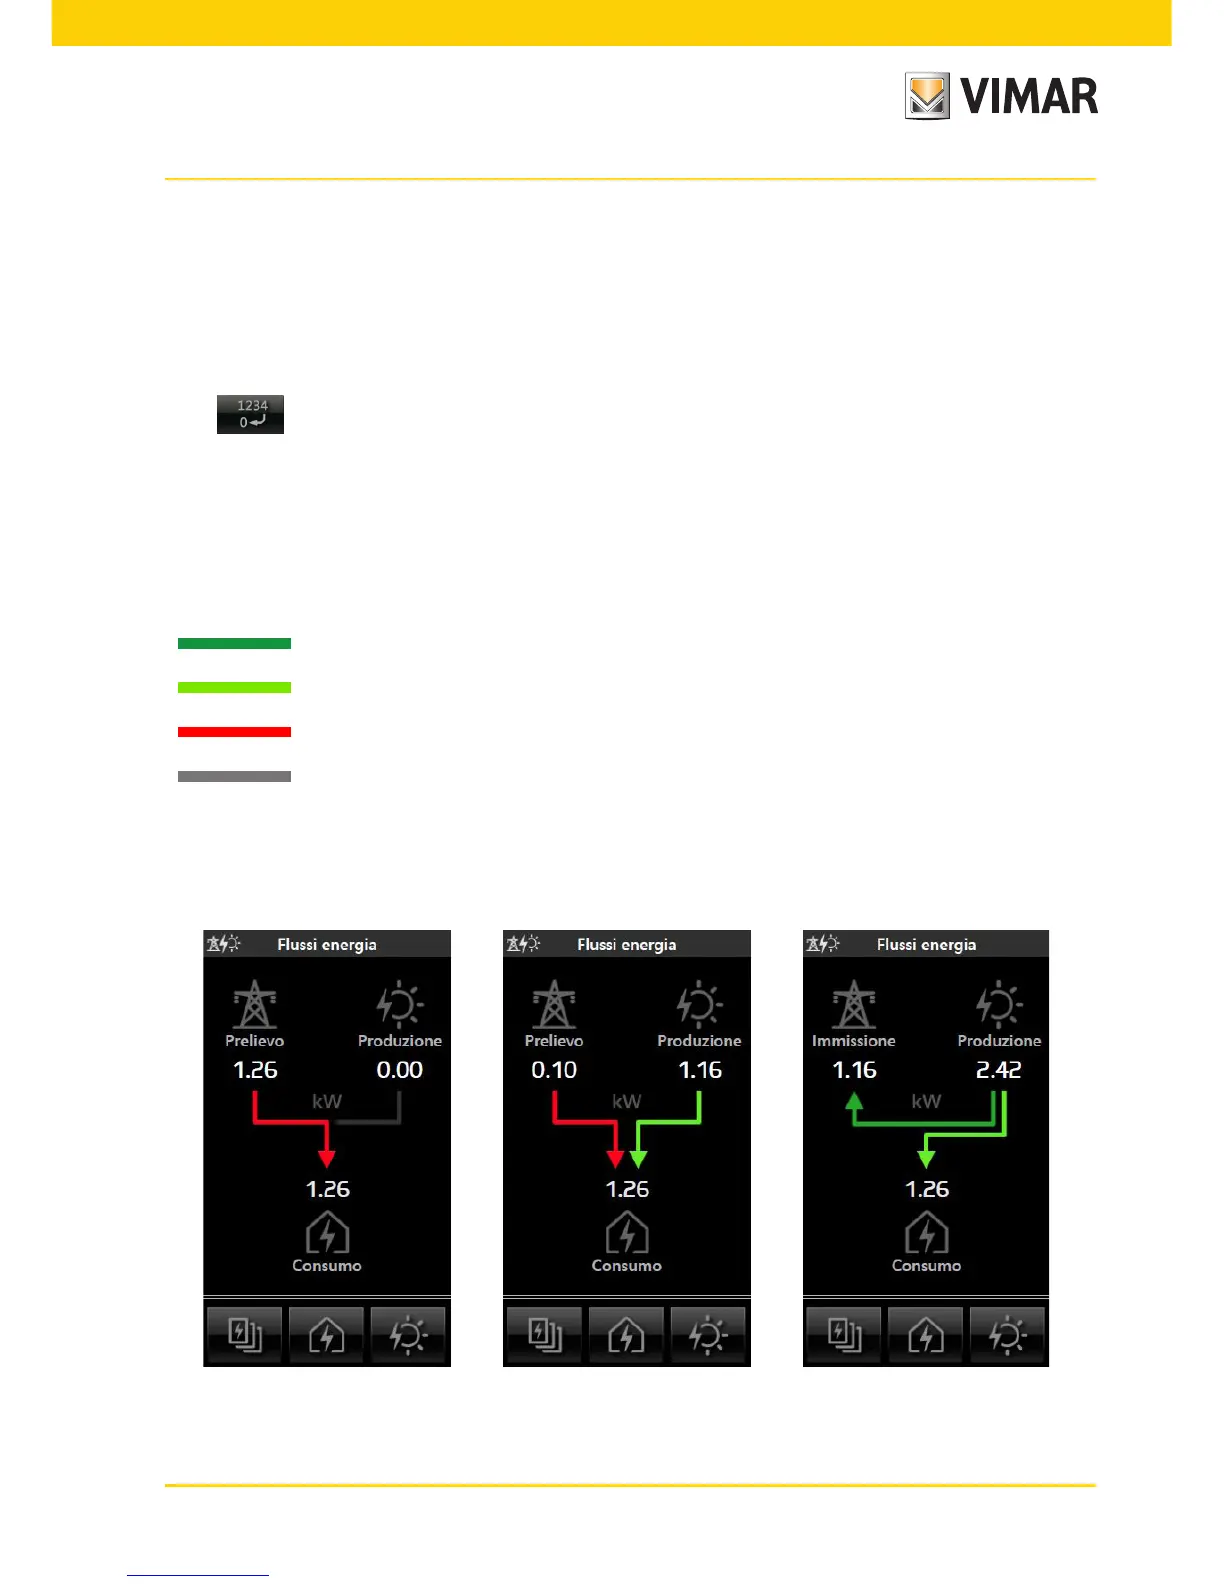
6.4 ENERGY FLOWS
The energy flow screens quickly and intuitively show the energy exchanges in progress and let you at any time see
the state of your consumption, production and any tapping off from or feeding in to the power grid.
The direction of the arrows indicates the direction of the energy while their colour indicates respectively:
- : Energy fed in
- : Energy self-consumed
- : Energy tapped off
- : No energy exchange
If both are present, "tap-off" and "feed-in" are displayed alternately according to the direction of energy.
The following are some of the screens that appear most frequently: