36
6.6 PULSE COUNTER
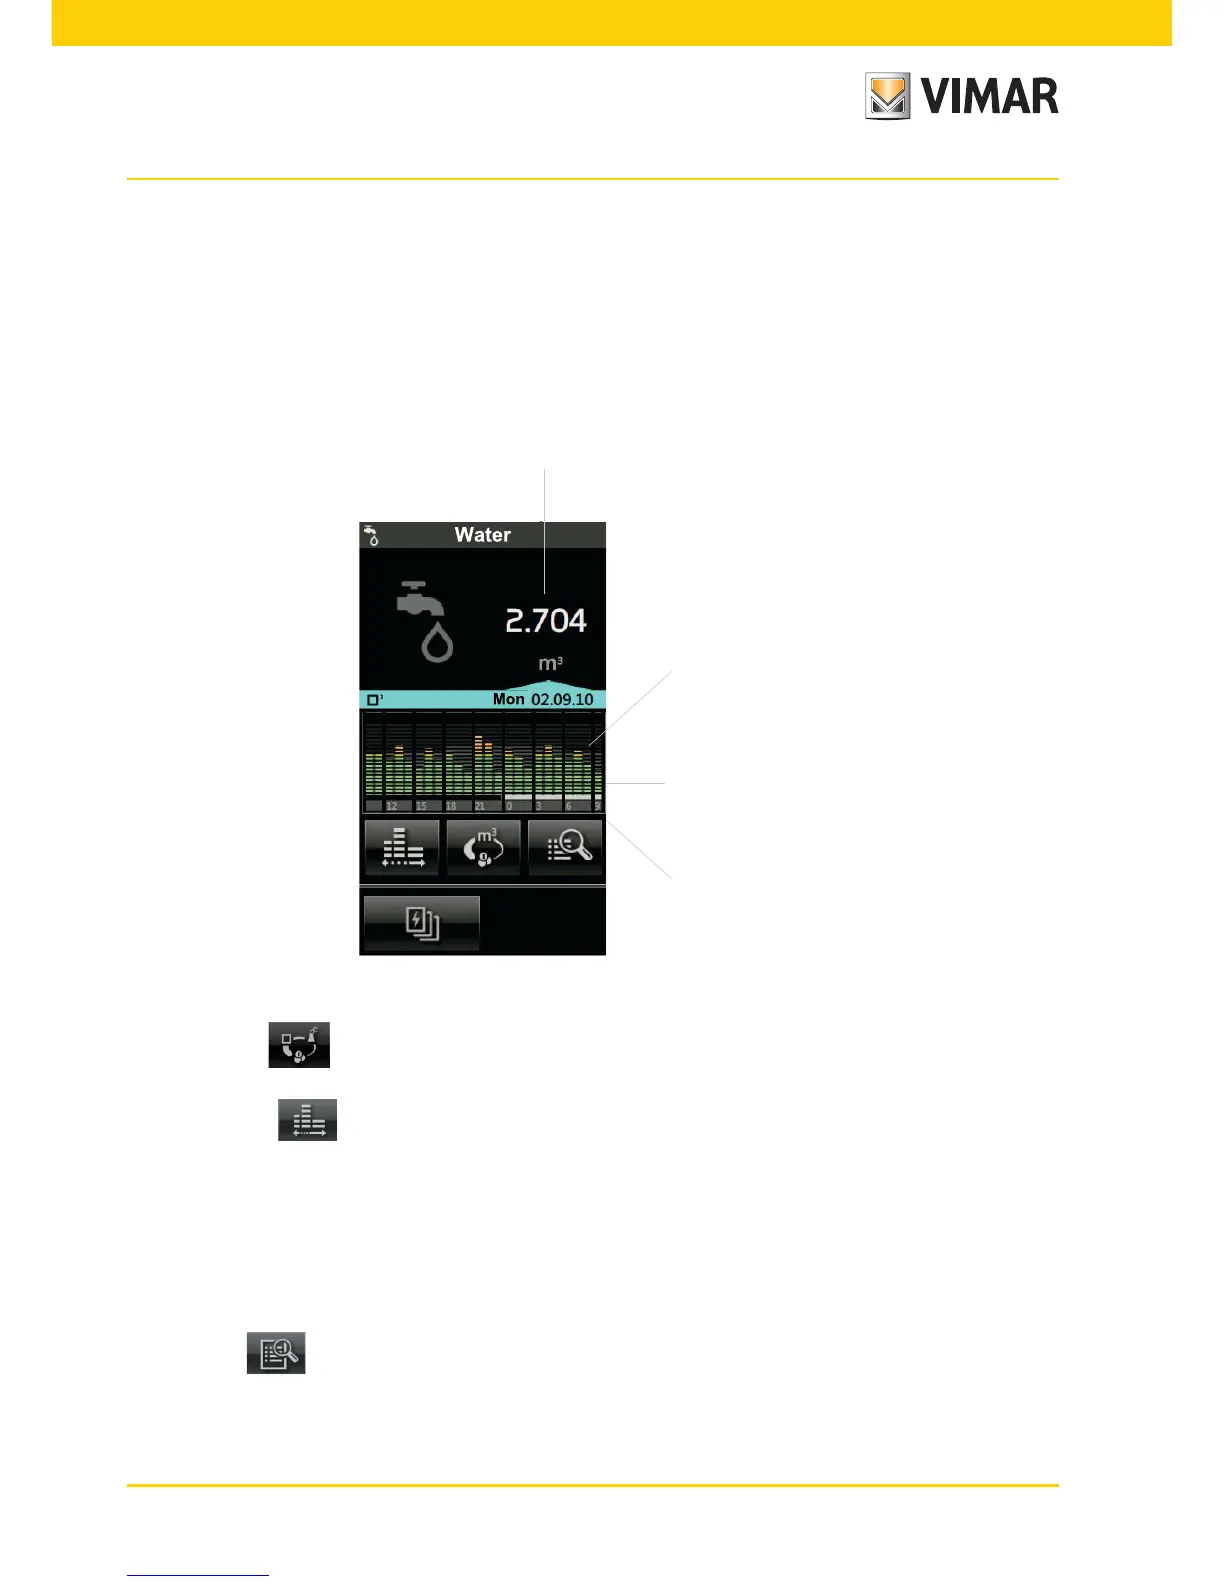
From the consumption monitoring menu (chapter 8), tapping the Pulse Counter icon takes you to the screen for
viewing and managing the consumption of utilities such as Water, Gas, etc. with:
- an indication of the overall consumption;
- a bar chart of the consumption or cost in euro subdivided by day/week/month/year;
Green indicates a value below the average, the intermediate green/orange indicates the last mark before reaching
the average value, orange a value above the average and the grey background indicates the average.
Indication of average consumption
Total consumption
Consumption histogram
Values displayed in the consumption
quantity
• By tapping the icon you can set the type of measurement with which the touch screen shows the data
(consumption in m
3
, cost in euro);
• By tapping the icon you can set the time scale (hours, days, weeks, months) for measuring the con-
sumption.
The quantitative consumption displayed is:
- daily if the time scale set for the histogram is in hours;
- weekly if the time scale set for the histogram is in days;
- monthly if the time scale set for the histogram is in weeks;
- yearly if the time scale set for the histogram is in months.
• Tapping the icon displays the detailed consumption screens according to the set unit of measurement
and time scale.
Energy monitoring