28
Energy monitoring
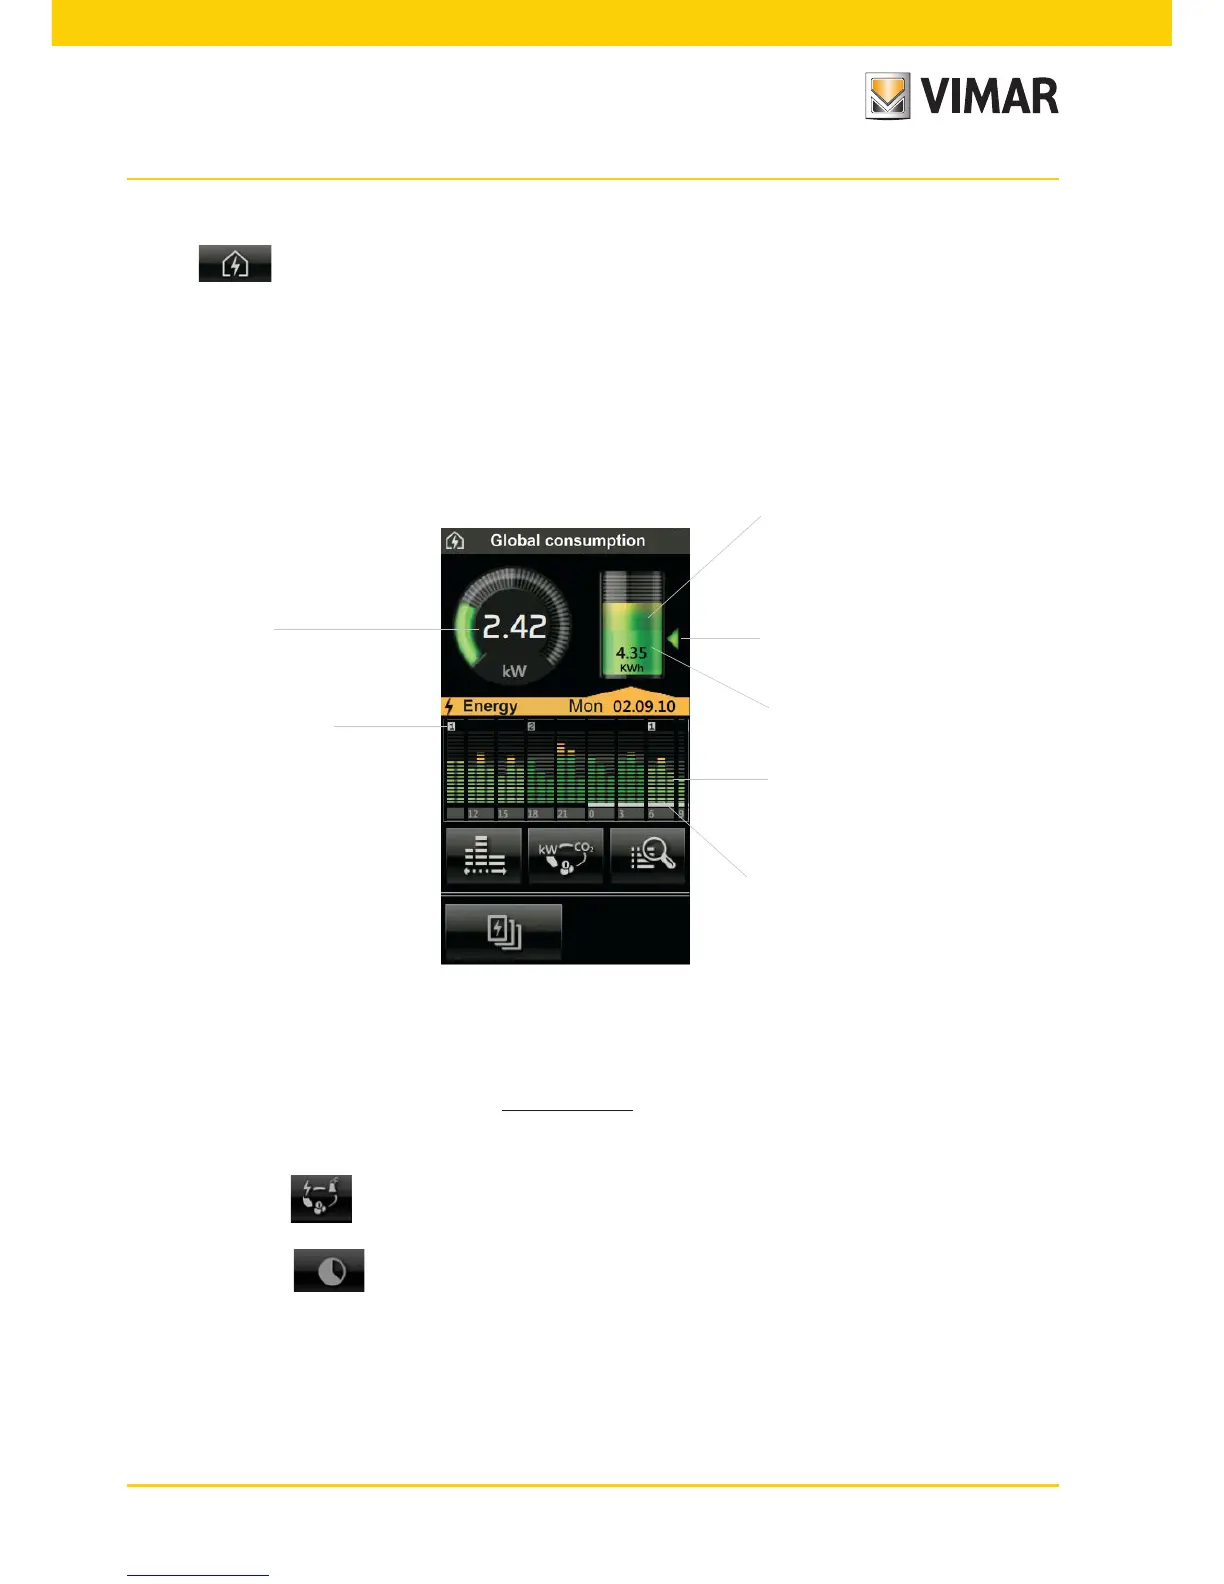
6.2 GLOBAL CONSUMPTION
Tapping brings up the screen for viewing and managing the energy consumption of the house (Energy
Guard) with:
- an indication of the instantaneous power in kW or CO
2
or cost in euro;
- an indication of the accumulated energy in kW/h or CO
2
or cost in euro;
- a bar chart of the accumulated energy in kW/h subdivided by day/week/month/year
Green indicates a value below the average, orange a value above the average and the grey background indicates
the average.
Dynamic Mode: Pressing the area that displays the instantaneous power for 2 min after the reading of the
will value every 2 s thus increasing the frequency of update of the data represented. At the end of 2 min, the
reading will repeat every 30 seconds until an eventual new pressure.
IMPORTANT: The displayed value (in euro) is approximate: it is the equivalent in € of the energy consumed
and is not directly comparable to the total amount of the bill, which takes account of fixed costs, any
increases in energy prices during the two-month period and adjustments.
• Toccando l’icona si visualizzano in modo sequenziale e circolare i dati relativi ai consumi energetici (in
kWh), alle emissioni di gas serra (se questa funzione è stata abilitata dall'installatore) ed ai costi.
• Toccando l’icona si visualizza un'ulteriore schermata che, per mezzo di un grafico circolare ed una
serie di istrogrammi, indica le percentuali di energia prelevata ed energia autoconsumata sul totale rappresentato
dall’Energia consumata.
Consumption time slot
indicator
Instantaneous
consumption
Estimated quantitative
consumption
Average quantitative
consumption
Consumption histogram
Current quantitative
consumption
Values displayed in the
consumption quantity icon