34
6.5 SINGLE LOAD CONSUMPTION
From the consumption monitoring menu (chapter 8), tapping the icon of the desired load (e.g. Fridge) brings
up the screen (quite similar to that for global consumption) for viewing and managing power consumption with:
- an indication of the instantaneous power in W or CO
2
or cost in euro;
- an indication of the accumulated energy in kW/h or CO
2
or cost in euro;
- a bar chart of the accumulated energy in kW/h subdivided by day/week/month/year.
Green indicates a value below the average, the intermediate green/orange indicates the last mark before reaching
the average value, orange a value above the average and the grey background indicates the average.
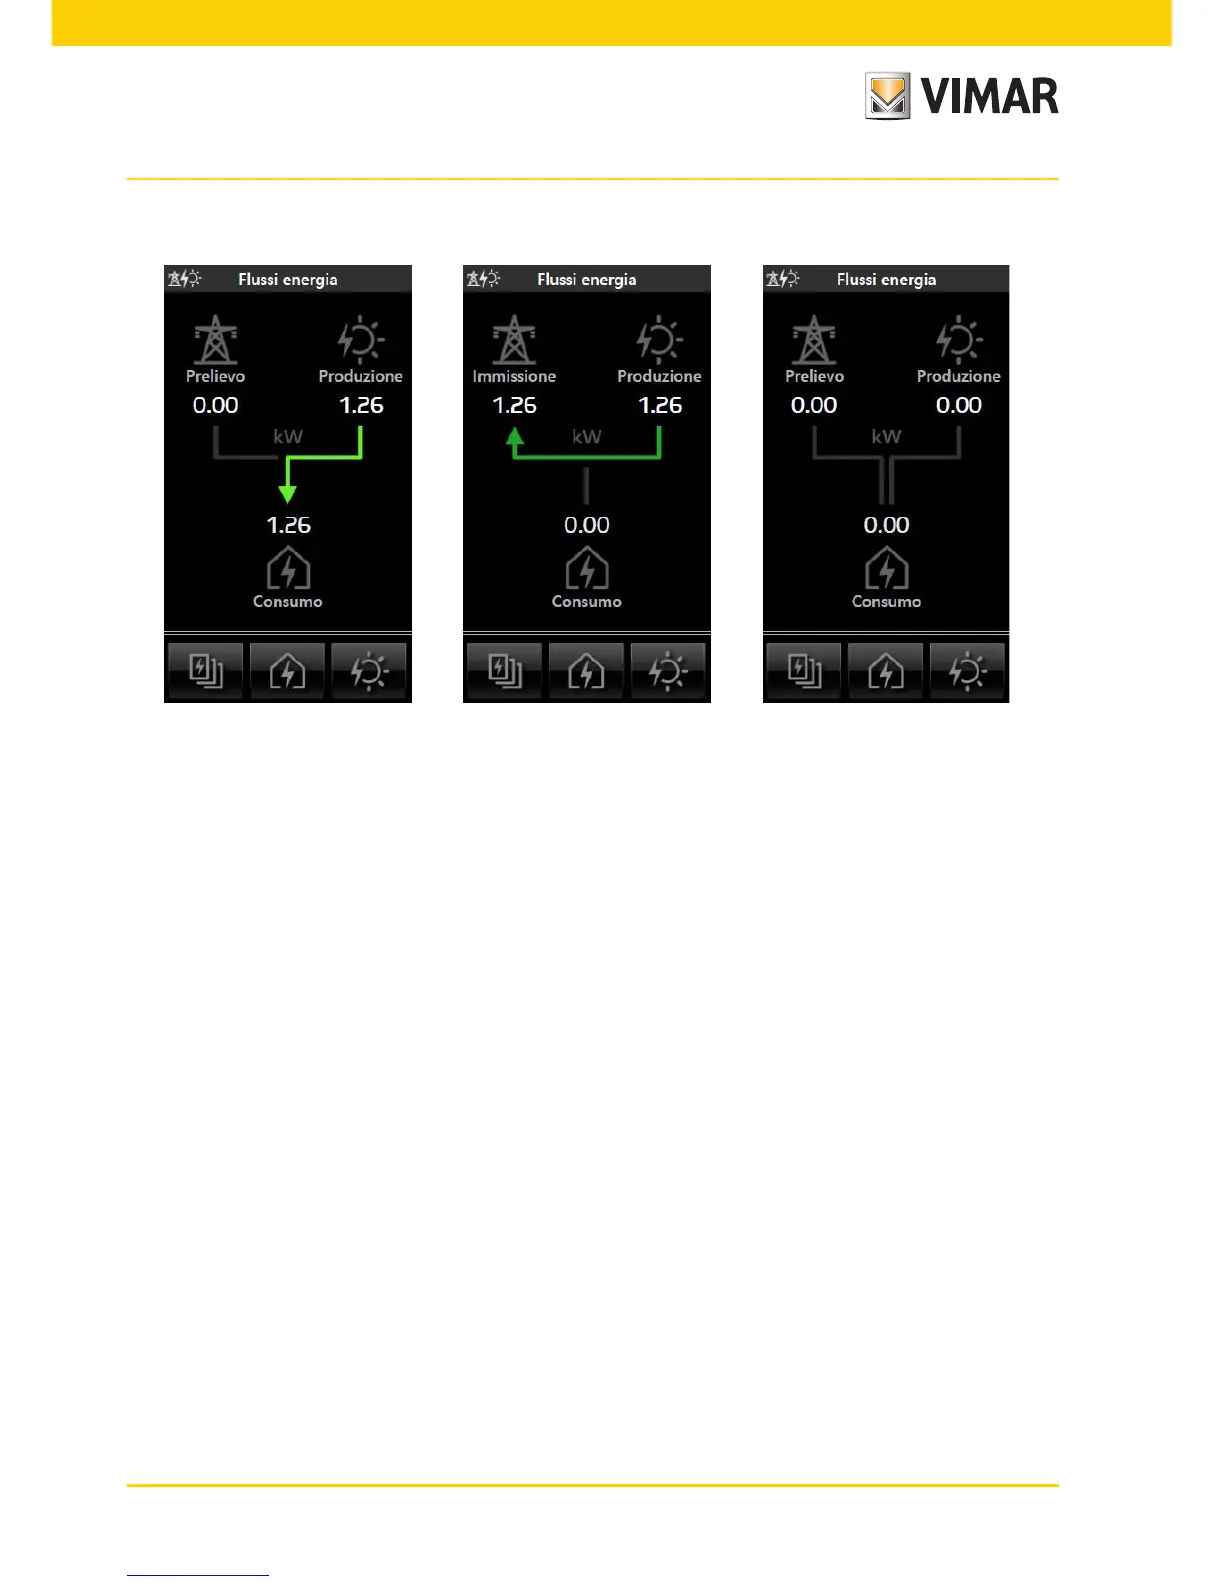
Energy monitoring
Conversely, the following screens illustrate situations that are shown less frequently: