49
4. Operating procedure
Temperature increase & decrease (reference data)
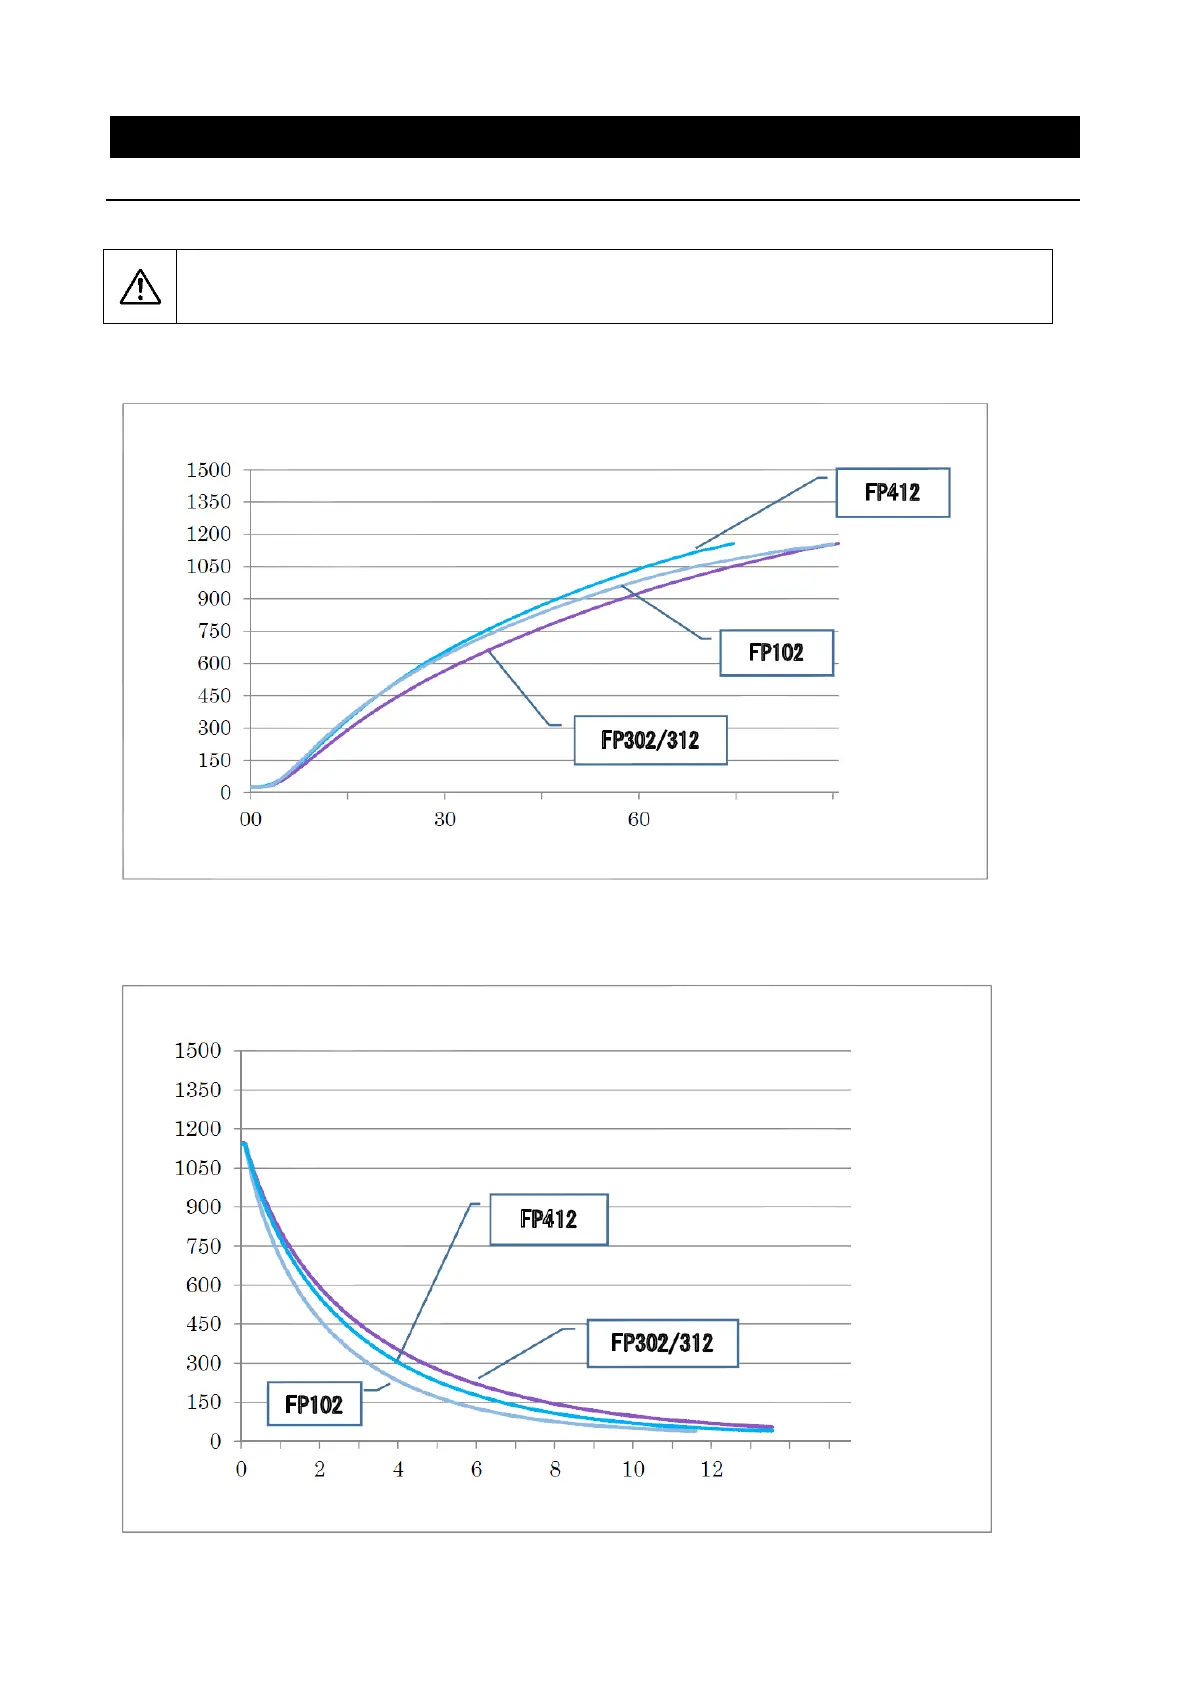
The graph below shows temperature increase & decrease data for different models.
Use the data only as a reference since it will change depending on the amount of samples or
the environmental temperature.
Use these figures as a reference for temperature increase during programming.
Use these figures as a reference for temperature decrease during programming.
FP102/302/312/412_Temperature Decrease Time
FP102/302/312/412_Temperature Increase Time



 To Next Page