Displaying Data 2
Agilent 1000B Series Oscilloscopes User’s Guide 43
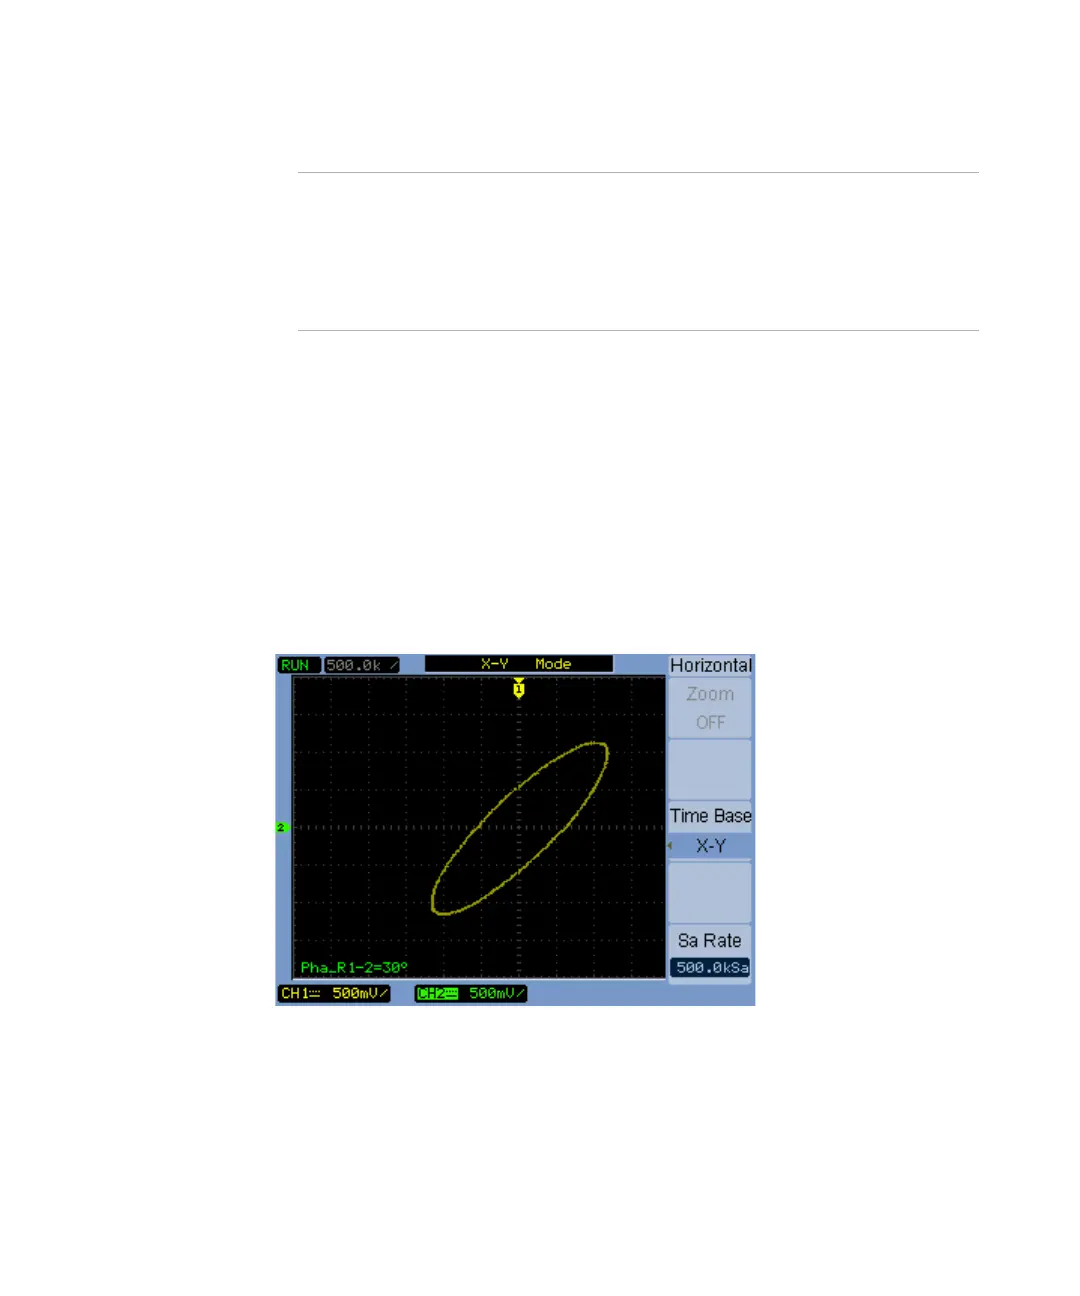
X-Y Format
This format compares the voltage level of two waveforms point by point. It
is useful for studying phase relationships between two waveforms. This
format only applies to channels 1 and 2. Choosing the X-Y display format
displays channel 1 on the horizontal axis and channel 2 on the vertical
axis.
The oscilloscope uses the untriggered sample acquisition mode and
waveform data is displayed as dots. The sampling rate can vary from
4 kSa/s to 100 MSa/s, and the default sampling rate is 1 MSa/s.
Roll In Roll mode, the waveform display rolls from right to
left, and the minimum horizontal scale setting is
500 ms/div. No trigger or horizontal position control is
available. Roll mode is used in applications similar to the
ones for which Slow Scan mode is used (see “Slow Scan
Mode” on page 40).
Figure 14 X-Y Display Format Showing Out-of-Phase Waveforms
 Loading...