40 Chapter 3
Making a Basic Measurement
Viewing a Signal
Setting Frequency Span
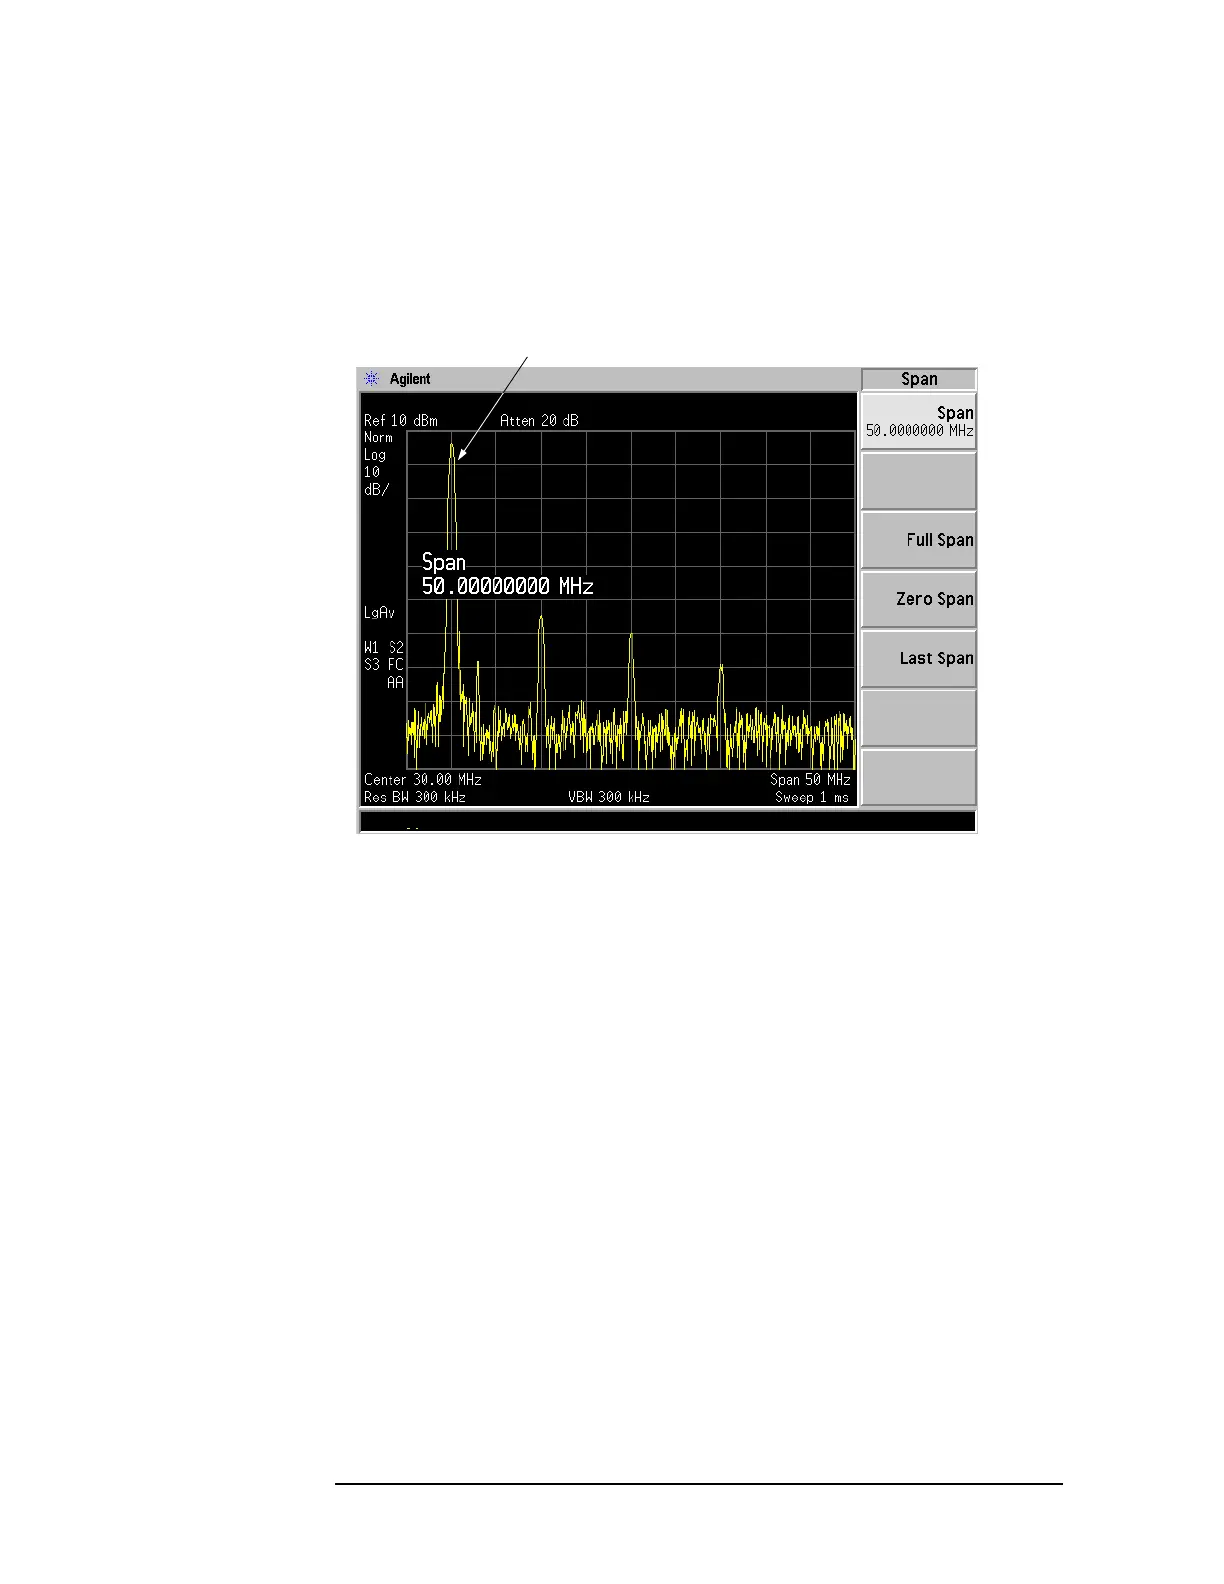
6. Set the frequency span to 50 MHz: Press
SPAN, 5, 0, MHz.
This displays the signal as shown in Figure 3-2.
Figure 3-2 Span Changed to 50 MHz
Reading Frequency & Amplitude
7. Place a marker (labeled 1) on the 10 MHz peak, as shown in Figure 3-3.
Press
Peak Search.
The frequency and amplitude of the marker appears both in the active function
block, and in the upper-right corner of the screen. You can use the knob, the
arrow keys, or the softkeys in the Peak Search menu to move the marker.
Pressing
Esc removes the value from the display.
8. If you have moved the marker, return it to the peak of the 10 MHz signal.
Changing Reference Level
9. Press
AMPLITUDE. The reference level (Ref Level) is now the active
function. Press
Marker Mkr Ref Lvl.
Changing the reference level changes the amplitude value of the top graticule
line.
Figure 3-4 shows the relationship between the center frequency and the
reference level. The box represents the analyzer display. Changing the center
frequency changes the horizontal placement of the signal on the display.
Changing the reference level changes the vertical placement of the signal on
 Loading...