Chapter 3 45
Making a Basic Measurement
Viewing a Signal
Figure 3-4 shows the relationship between center frequency and reference level. The box
represents the analyzer display. Changing the center frequency changes the horizontal placement
of the signal on the display. Changing the reference level changes the vertical placement of the
signal on the display. Increasing the span increases the frequency range that appears horizontally
across the display.
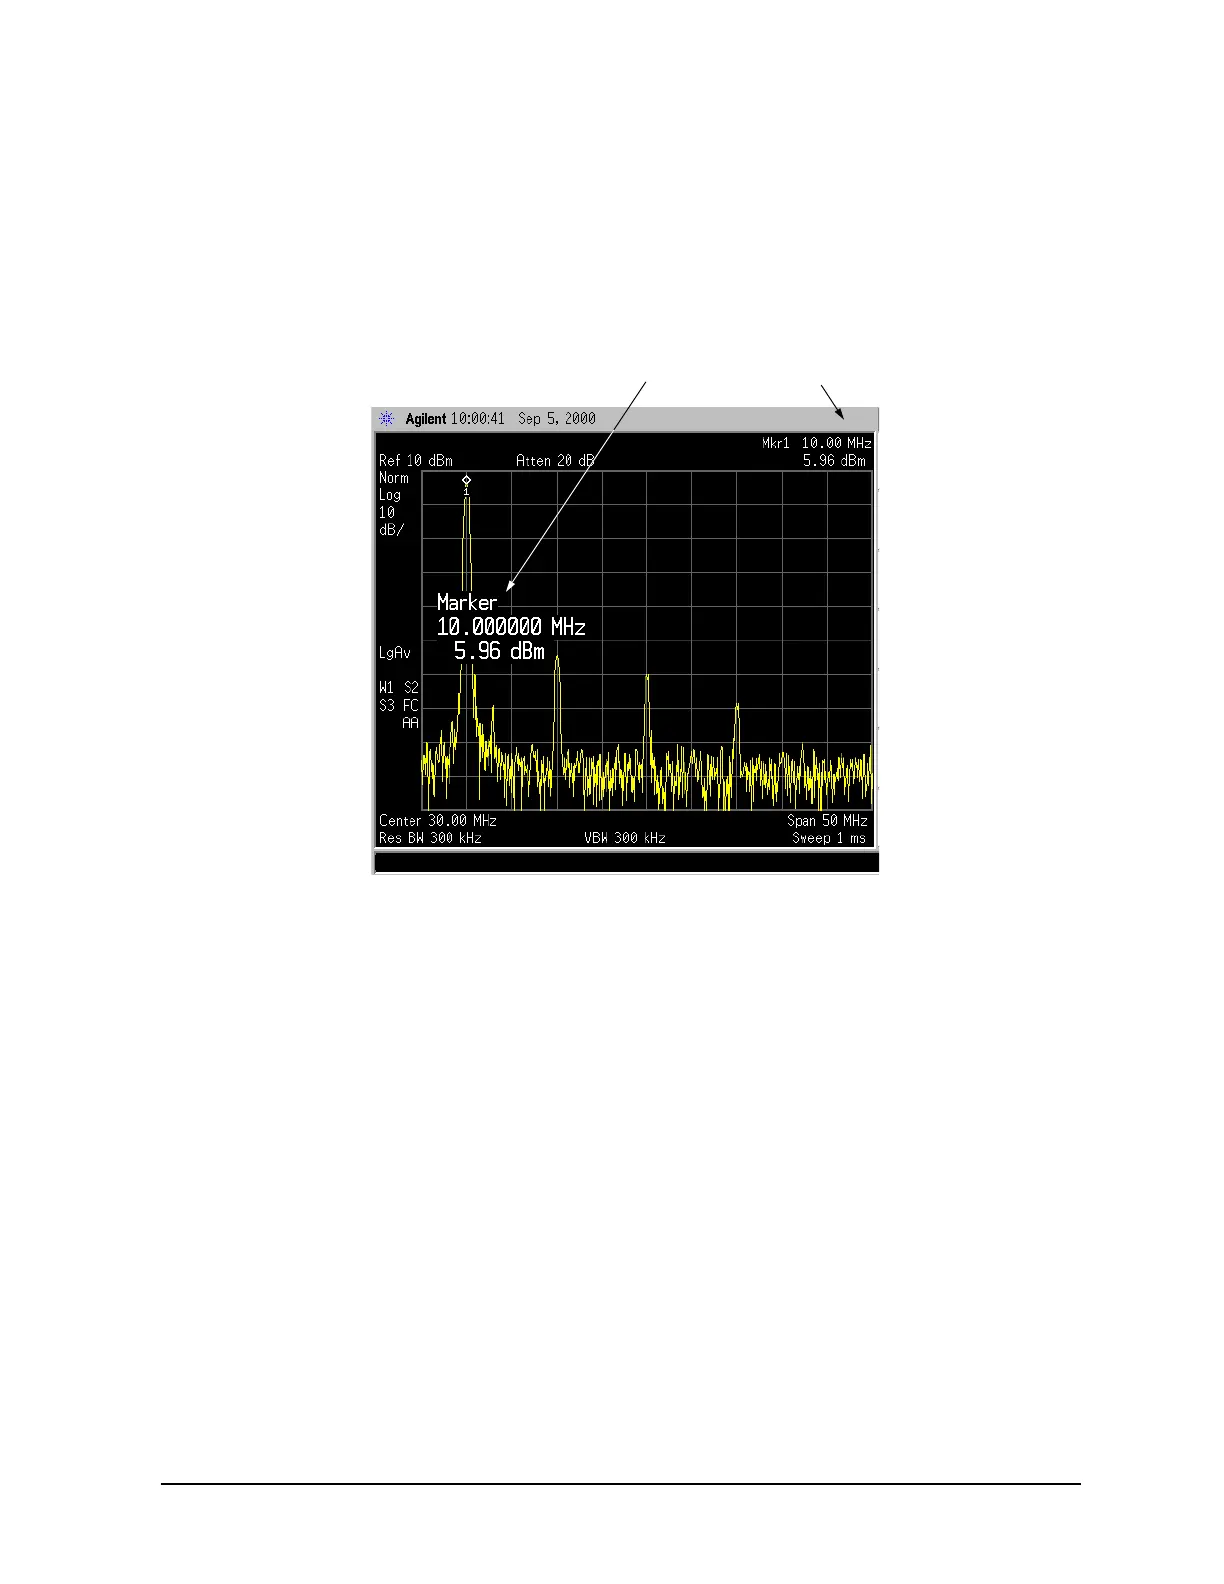
Figure 3-3 A Marker on the 10 MHz Peak
 Loading...