b. Abnormal Conditions. Transmission fluid must be changed whenever there
is evidence of dirt in the fluid or the fluid is discolored, which indicates a high
temperature condition. Fluid analysis will also reveal a high temperature condition.
Local conditions, severity of operation, or duty cycle may require more or less
frequent fluid or filter changes.
c. Fluid Analysis. Transmissions used in high cycle rate applications should
have a fluid analysis performed to be sure of the proper change interval.
Transmission protection and fluid change intervals can be optimized by monitoring
fluid oxidation according to the tests and limits shown in Table 2–7. Consult your
local telephone directory for fluid analysis firms. To be sure of consistent and
accurate fluid analysis, use only one fluid analysis firm. Refer to the Technician’s
Guide for Automatic Transmission Fluid, GN2055EN, for additional information.
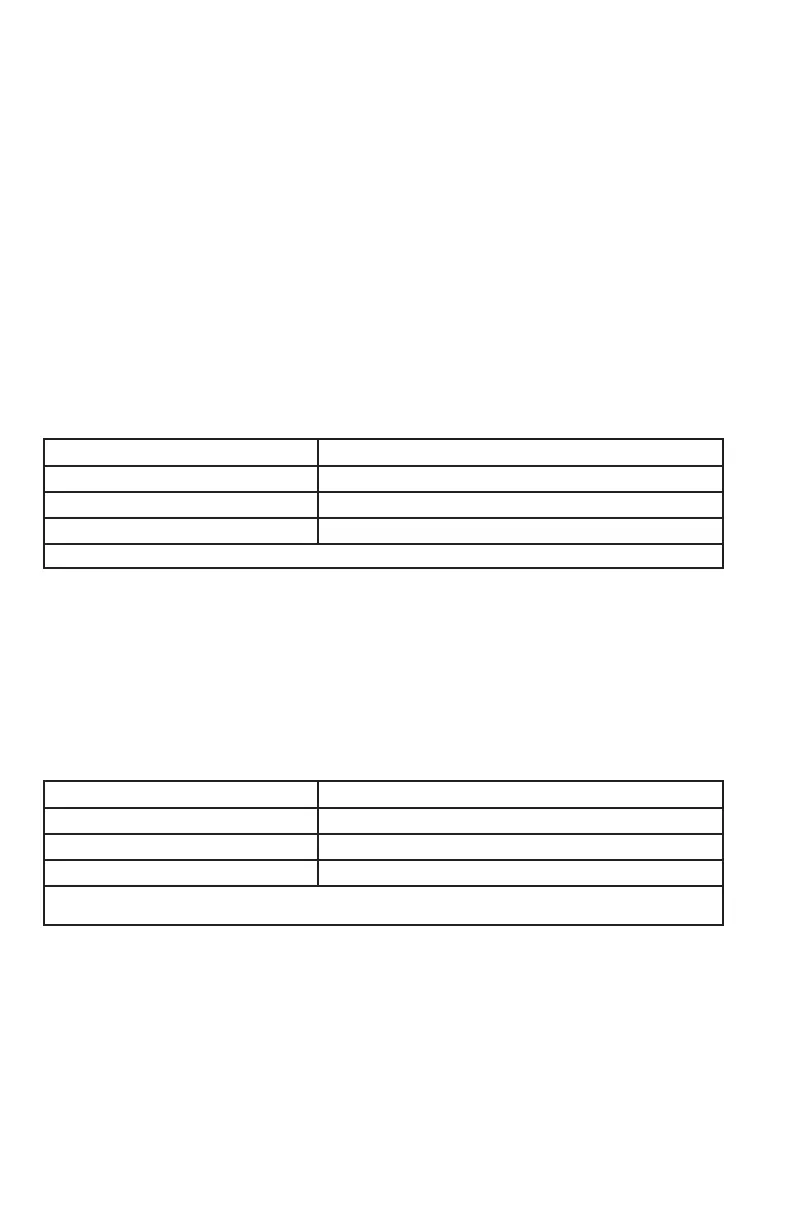
Table 2–7. Fluid Oxidation Measurement Limits
Test Limit
Viscosity ±25% change from new fluid
Total Acid Number +3.0
* change from new fluid
Solids 2 percent by volume maximum
* mg of potassium hydroxide (KOH) to neutralize a gram of fluid.
2–7. TRANSMISSION FLUID CONTAMINATION
a. Fluid Examination. The presence of fluid contamination in an automatic
transmission can be detrimental to continued operation. A normal amount of
condensation will appear in the fluid during operation. At each fluid change,
examine the drained fluid for evidence of dirt or water. Contamination limits are
shown in Table 2–8.
Contaminant Limit
Water 0.2% maximum
Glycol No trace allowed
Alien fluids
* If detected, change transmission fluid
* Any fluid not included on the Allison Approved Fluid List. The Approved Fluids Lists may be
found at the Allison Transmission website, www.allisontransmission.com.
b. Monitoring Wear. Absolute maximum values cannot be applied to wear
metals of an automatic transmission due to the many variables present that affect
concentration limits. Wear metal analysis results must be evaluated using a
trendline approach.
A trendline approach plots the concentration level of each wear metal over a
period of time. A minimum of four data points for each metal is required to
establish a trendline. A line of “best fit” drawn through the plotted points is
32
 Loading...