- 10 -
Alarm historic
2
3
4
5
6
7
8
9
10
11
12
1357911131517192123252729313335
hours
[ °C ]
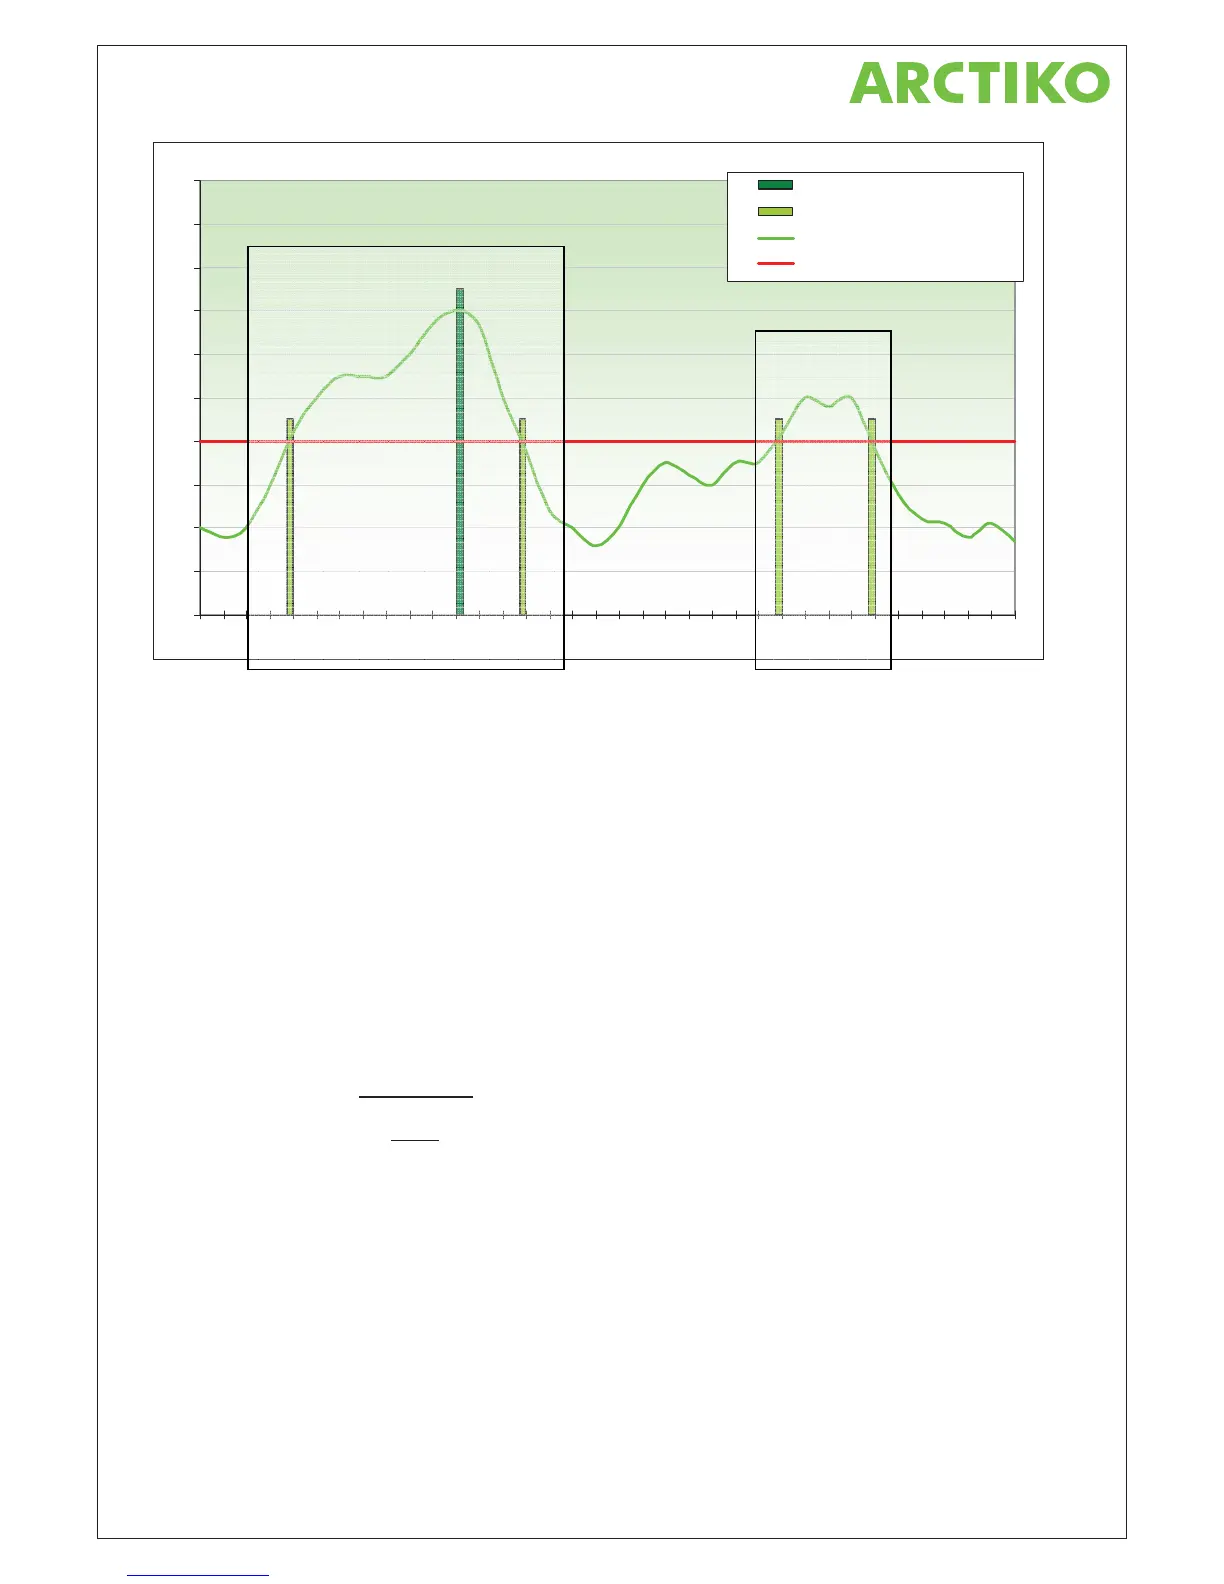
Max imu m me a s ur ed t e mp.
Temp. exceeds the alarm limit
Temperature
Alarm limit at +6 °C
Here above is given a graph which is an example how the temperature had been the last 36 hours. The cabinet
set point is set to +4 °C. The upper alarm limit is set to +6 °C.
Situation 3 – Large faulty period.
For about 32 hours ago the room temperature exceeds suddenly the upper alarm limit. The acoustic alarm
sounds, but the user isn’t there to interrupt the fault. The display is flashing.
7 hours later or for 25 hours ago, the temperature has reached to it’s maximum with a peak temperature on +9
°C. First after 3 hour the temperature again become normal or accepted.
The graph shows clearly that the room temperature has exceeded for at least 10 hours in the first period.
Situation 4 – Smaller faulty period.
Later a new faulty period occurs. This time the faulty period is 4 hours total and it started for about 11 hours
ago. The peak temperature is here only found to +7 °C.
The complete log picture will now be converted to two values or information.
The first information is the total time for the faulty periods. The total time is the sum of 1
st
and 2
nd
faulty period,
which are 10 + 4 hours = 14 hours total
.
The second information is the peak temperature found in one of the two faulty periods. In this case the highest
temperature peak is found to +9 °C
.
Situation 3
Situation 4