The Menus
bbe BenthoTorch Manual Page 91
Sorted by green algae descending:
XY
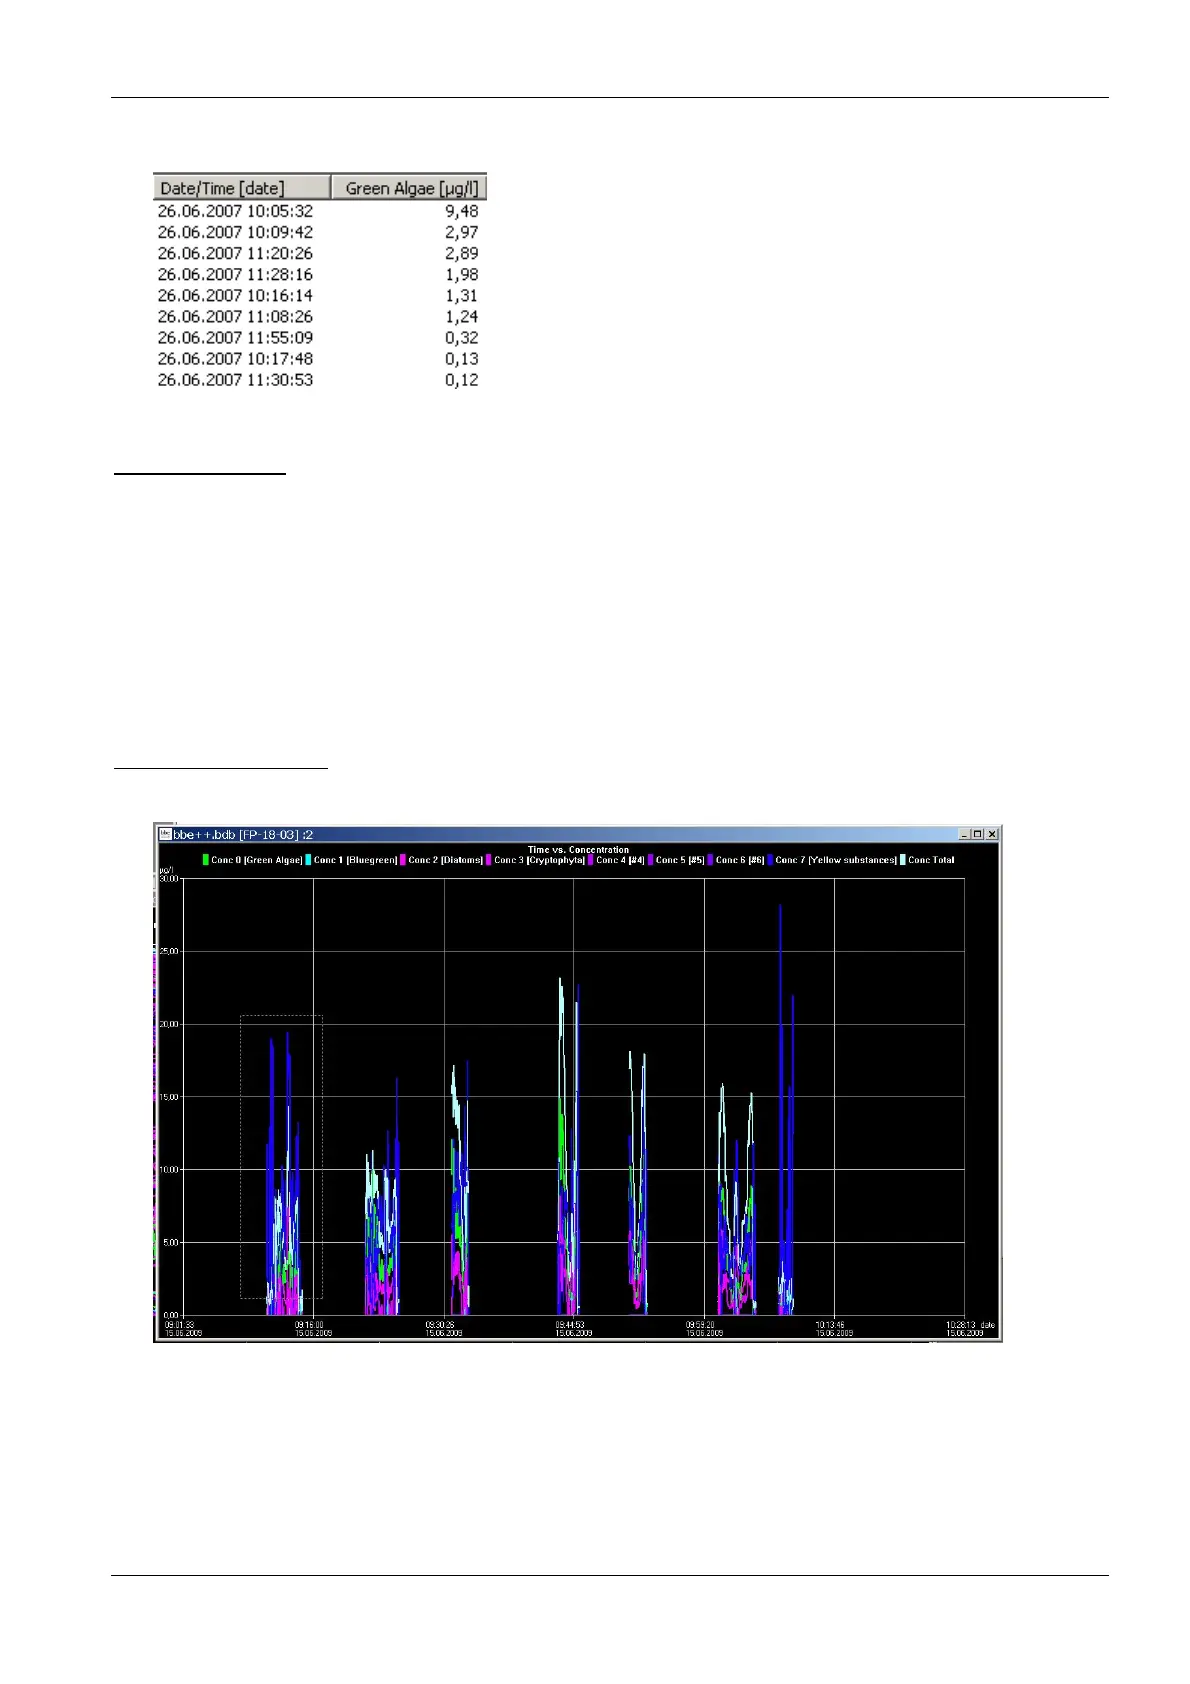
GRAPH VIEWS
Features of the XY graph view:
9. Select data of interest
10. Scaling of the axes (right click)
11. Display of the corresponding parameters (right click)
12. Editing a XY view, to change colours the type of graph.
13. Navigation within the data
Select data of interest
Please click and draw the mouse to select the required data.
A pop-up window is shown to choose the axis to which the selection is to be applied.