Instruction Manual for DAC3 HGC and DAC3 L with 2.X Firmware Page 63
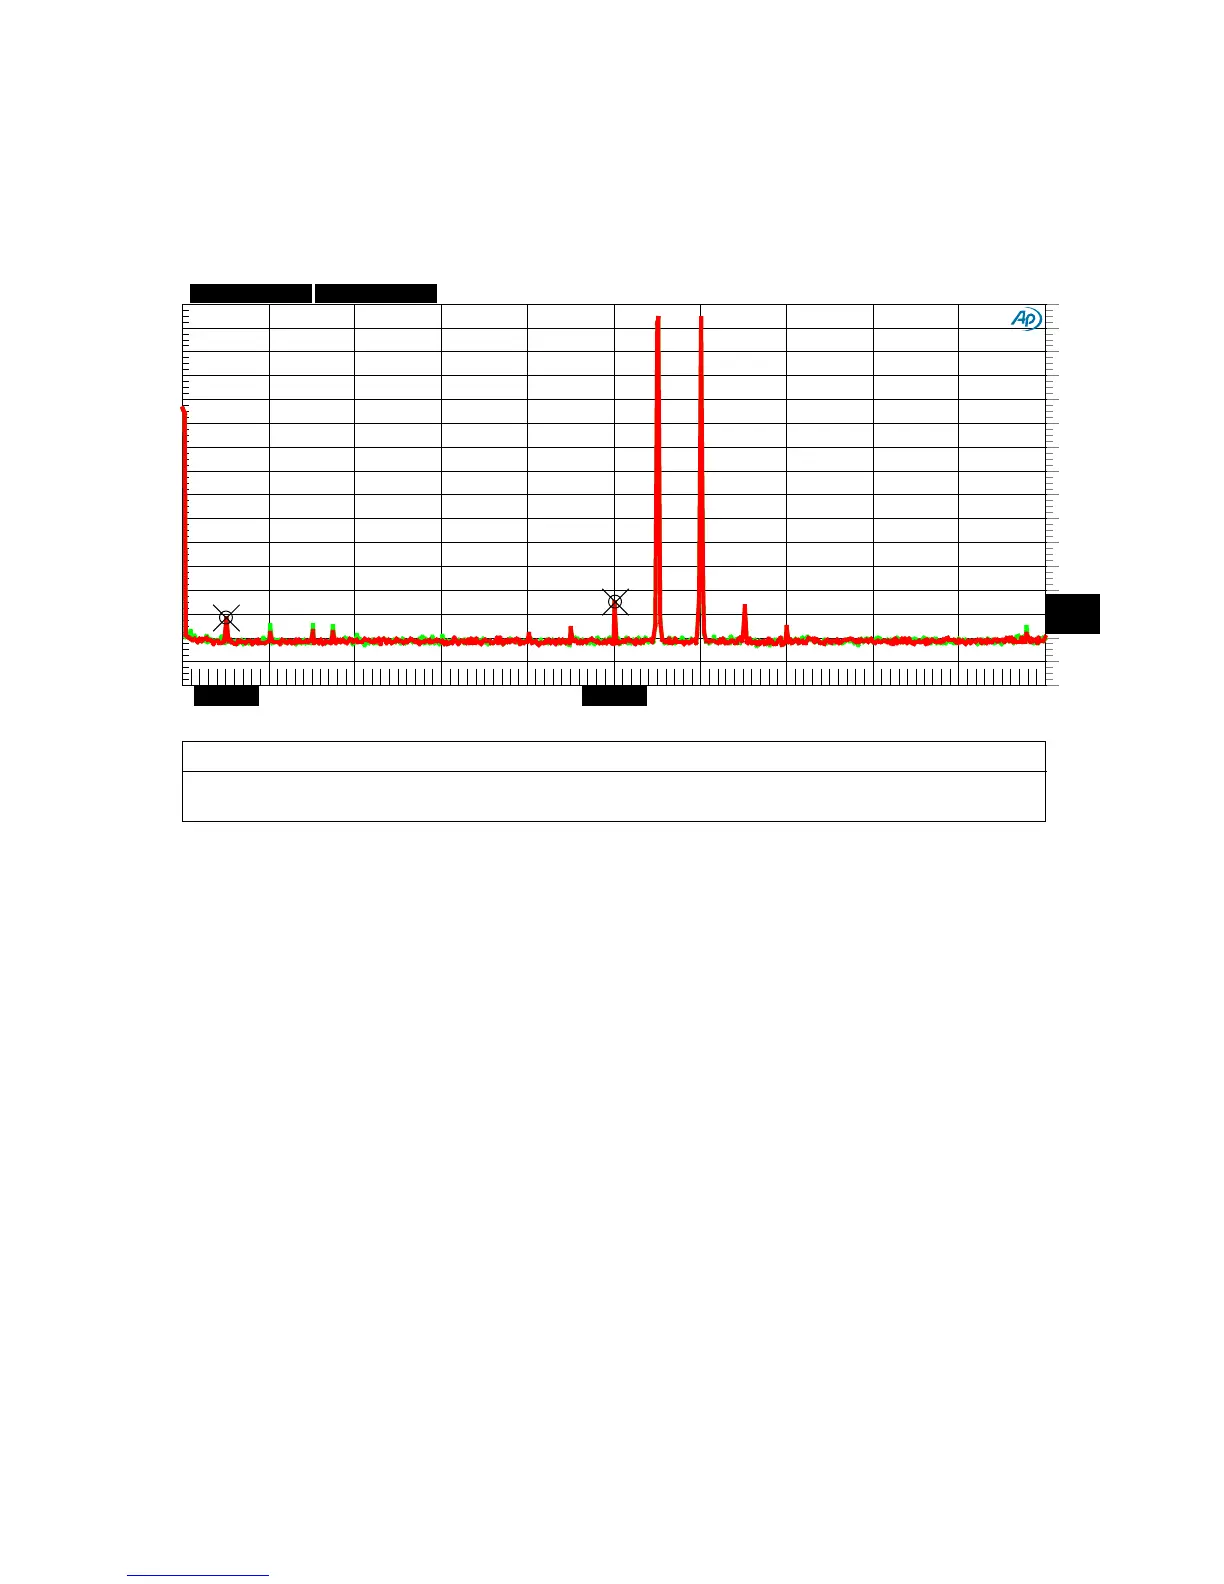
Graph 17 - IMD 11k 12K
This plot demonstrates that the DAC3 has very low IMD distortion. The 1 kHz difference frequency
measures -131 dB, and the 10 kHz and 13 kHz products measure about -125 dB. The actual IMD
may be better. The results shown are partially limited by the performance of the AP2722 test set.
All IMD distortion products should be well below audible levels.
Color
Sweep Trace Line Style Thick Data
Axis Comment Cursor1 Cursor2
1 1 Green Solid
4 Fft.Ch.1 Ampl Left
Left Channel -131.652 dBr A -125.861 dBr A
1 2 Red Solid
4 Fft.Ch.2 Ampl Right
Right Channel *-131.548 dBr *-124.799 dBr
-160
+0
-150
-140
-130
-120
-110
-100
-90
-80
-70
-60
-50
-40
-30
-20
-10
-160
+0
-150
-140
-130
-120
-110
-100
-90
-80
-70
-60
-50
-40
-30
-20
-10
0
20k 2k
4k
6k 8k
10k 12k
14k
16k
18k
1.01761k
10.0196k