Data Analysis Windows
90
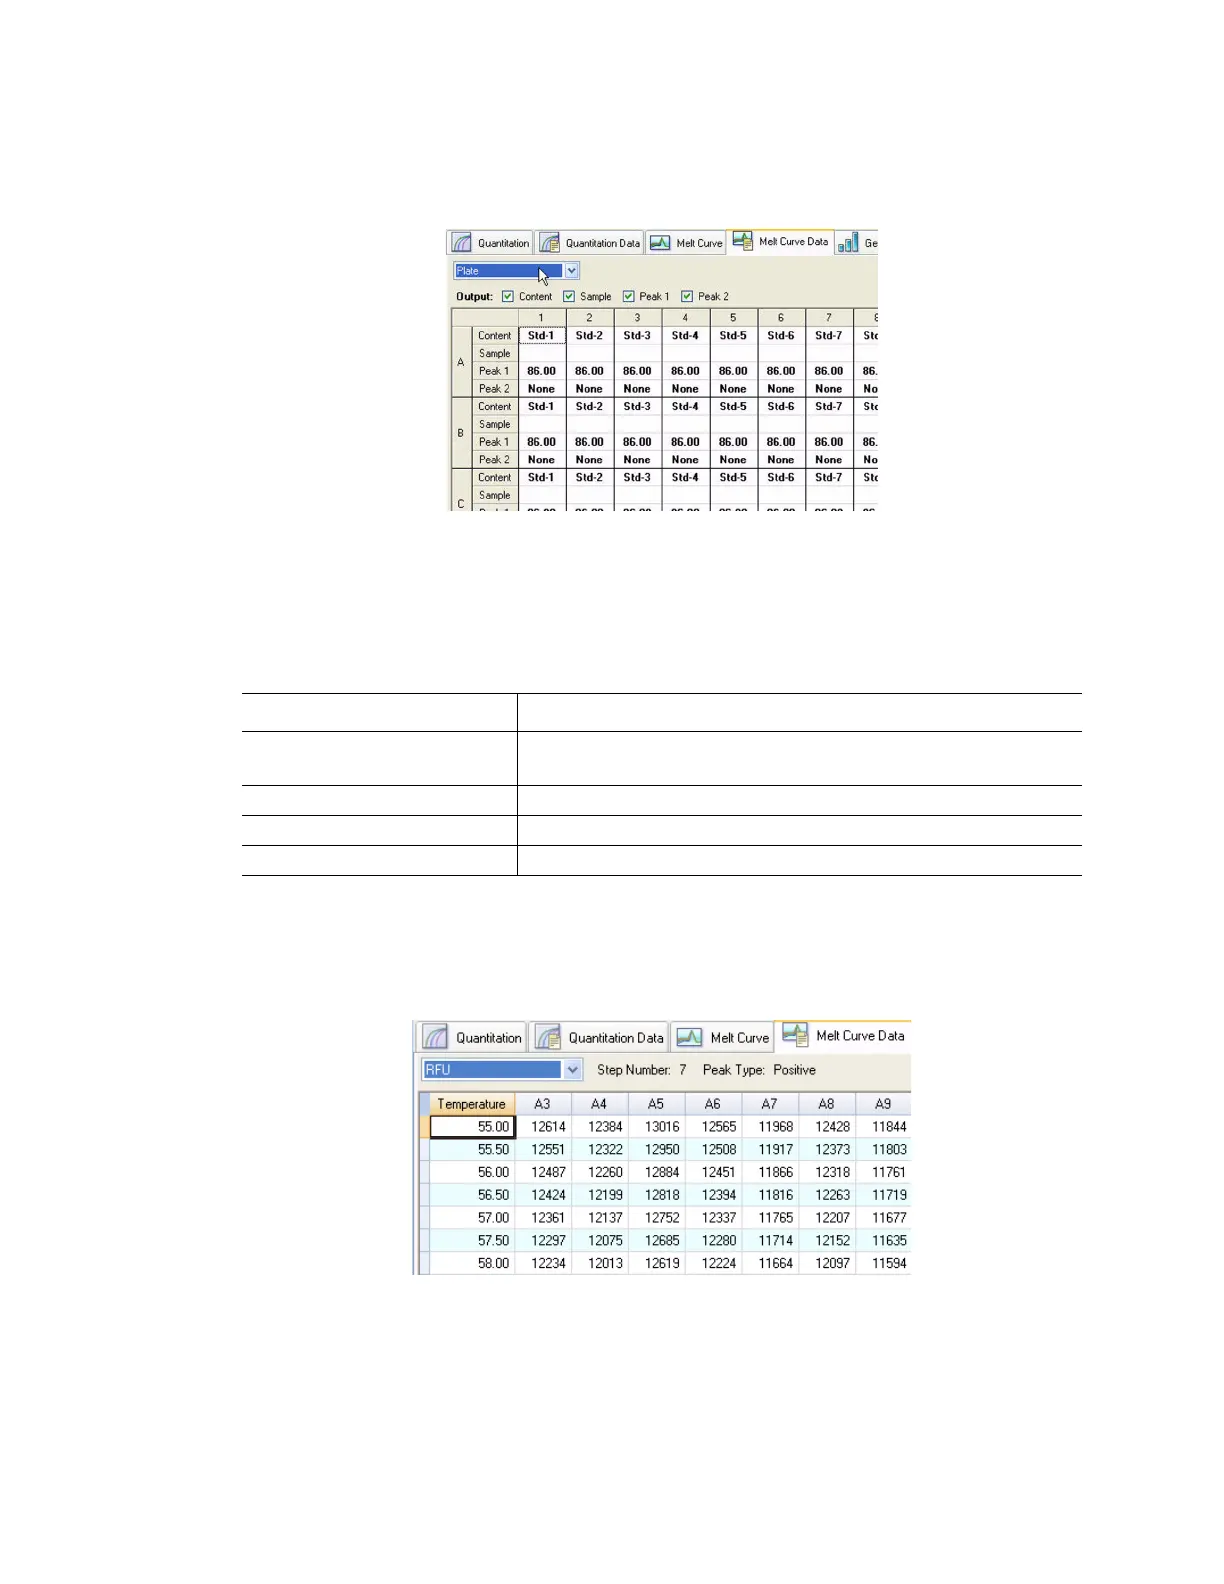
Plate Spreadsheet
Select the Plate spreadsheet (Figure 90) to view melt curve data in a plate format:
Figure 90. Plate spreadsheet in Melt Curve Data tab.
NOTE: To adjust the peak that the software calls, adjust the threshold line in the
Melt Peak chart on the Melt Curve tab.
The Plate spreadsheet includes the types of information shown in Table 31.
RFU Spreadsheet
Select the RFU spreadsheet to view the fluorescence for each well at each cycle acquired
during the melt curve (Figure 91).
Figure 91. RFU spreadsheet in Melt Curve Data tab.
Table 31. Plate spreadsheet content
Information Description
Content A combination of Sample Type (required) and Replicate #
(optional)
Sample Sample description
Peak 1 First melt peak (highest)
Peak 2 Second (lower) melt peak