17
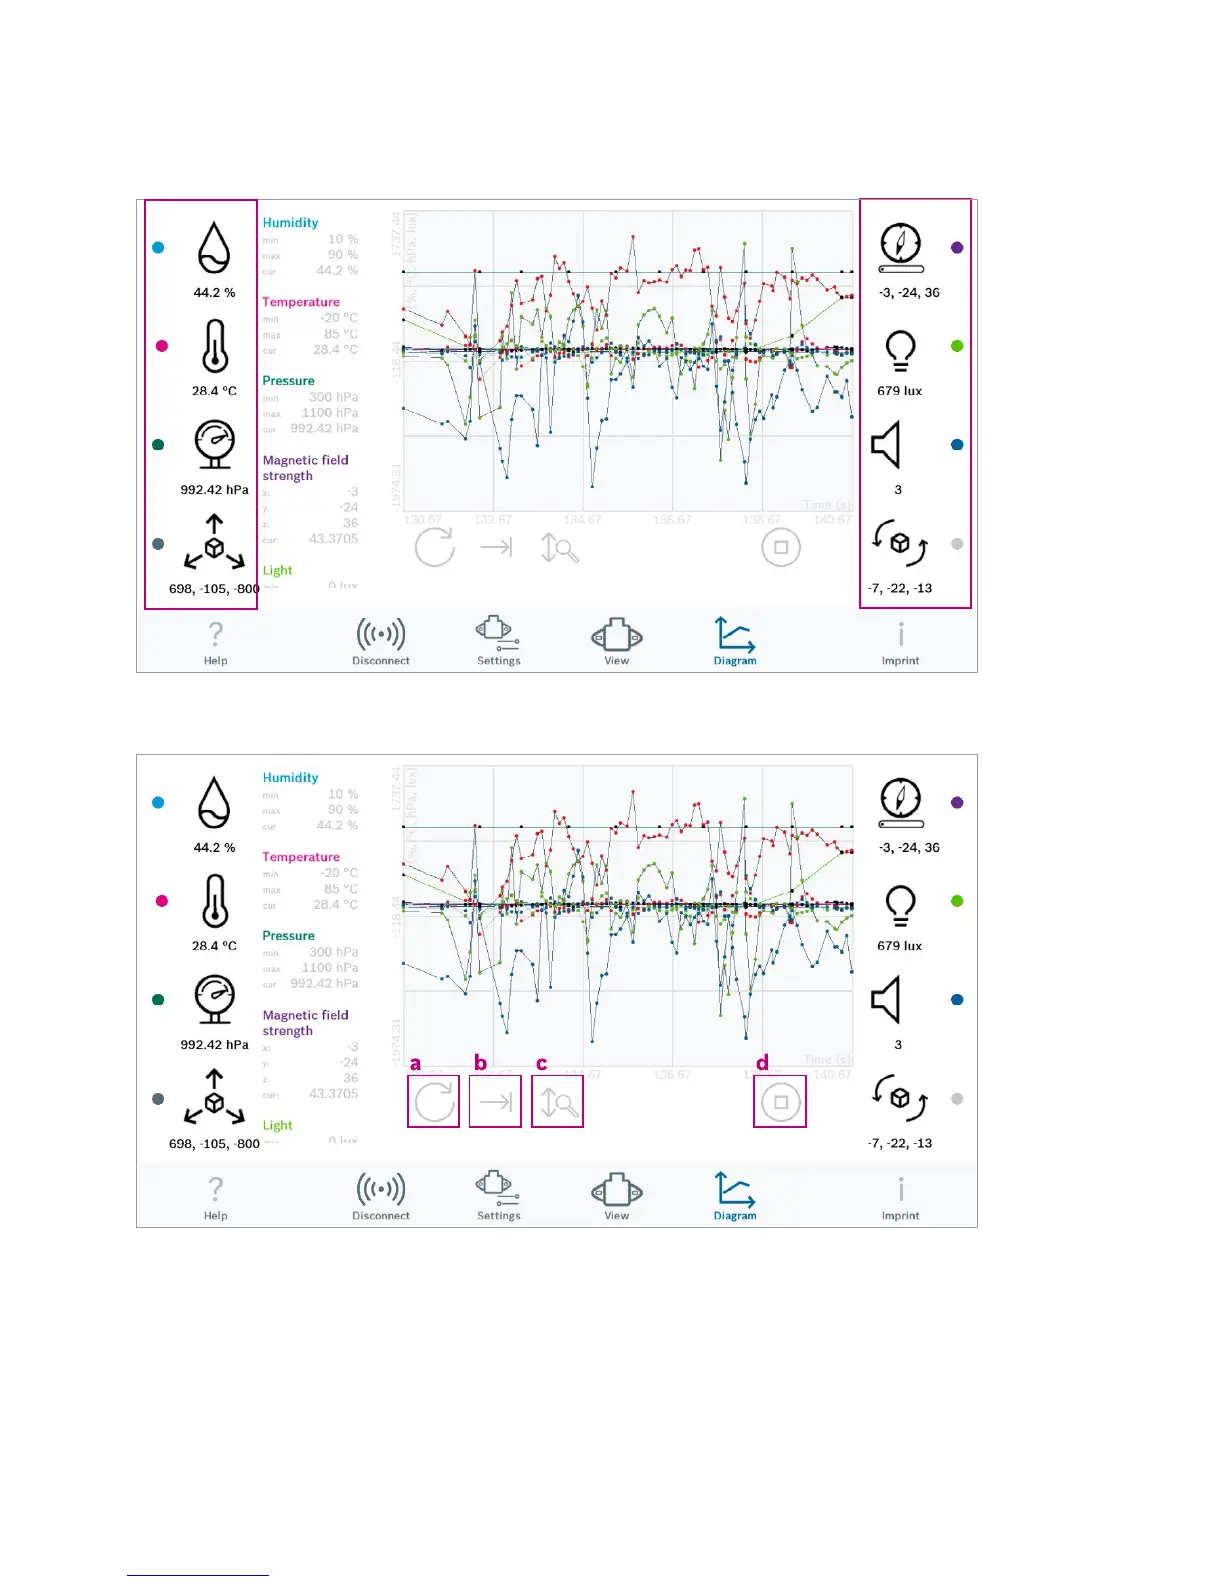
12. Select the sensors you want to see in the chart by taping on the sensor icons.
The graphs and the values become displayed.
Options using the chart view
a. Refresh: If the chart is zoomed by the user, click on this icon to recover the original view.
b. Enable / disable the scrolling of the visible window to show all X values in the graph
c. Enable / disable auto scale of the y axis of the graph
d. Play / stop: tap on to button to show streaming data in the graph / to freeze streaming data in the graph