Model 428 User’s Manual REMOTE USER INTERFACE
Bristol Instruments, Inc. 27
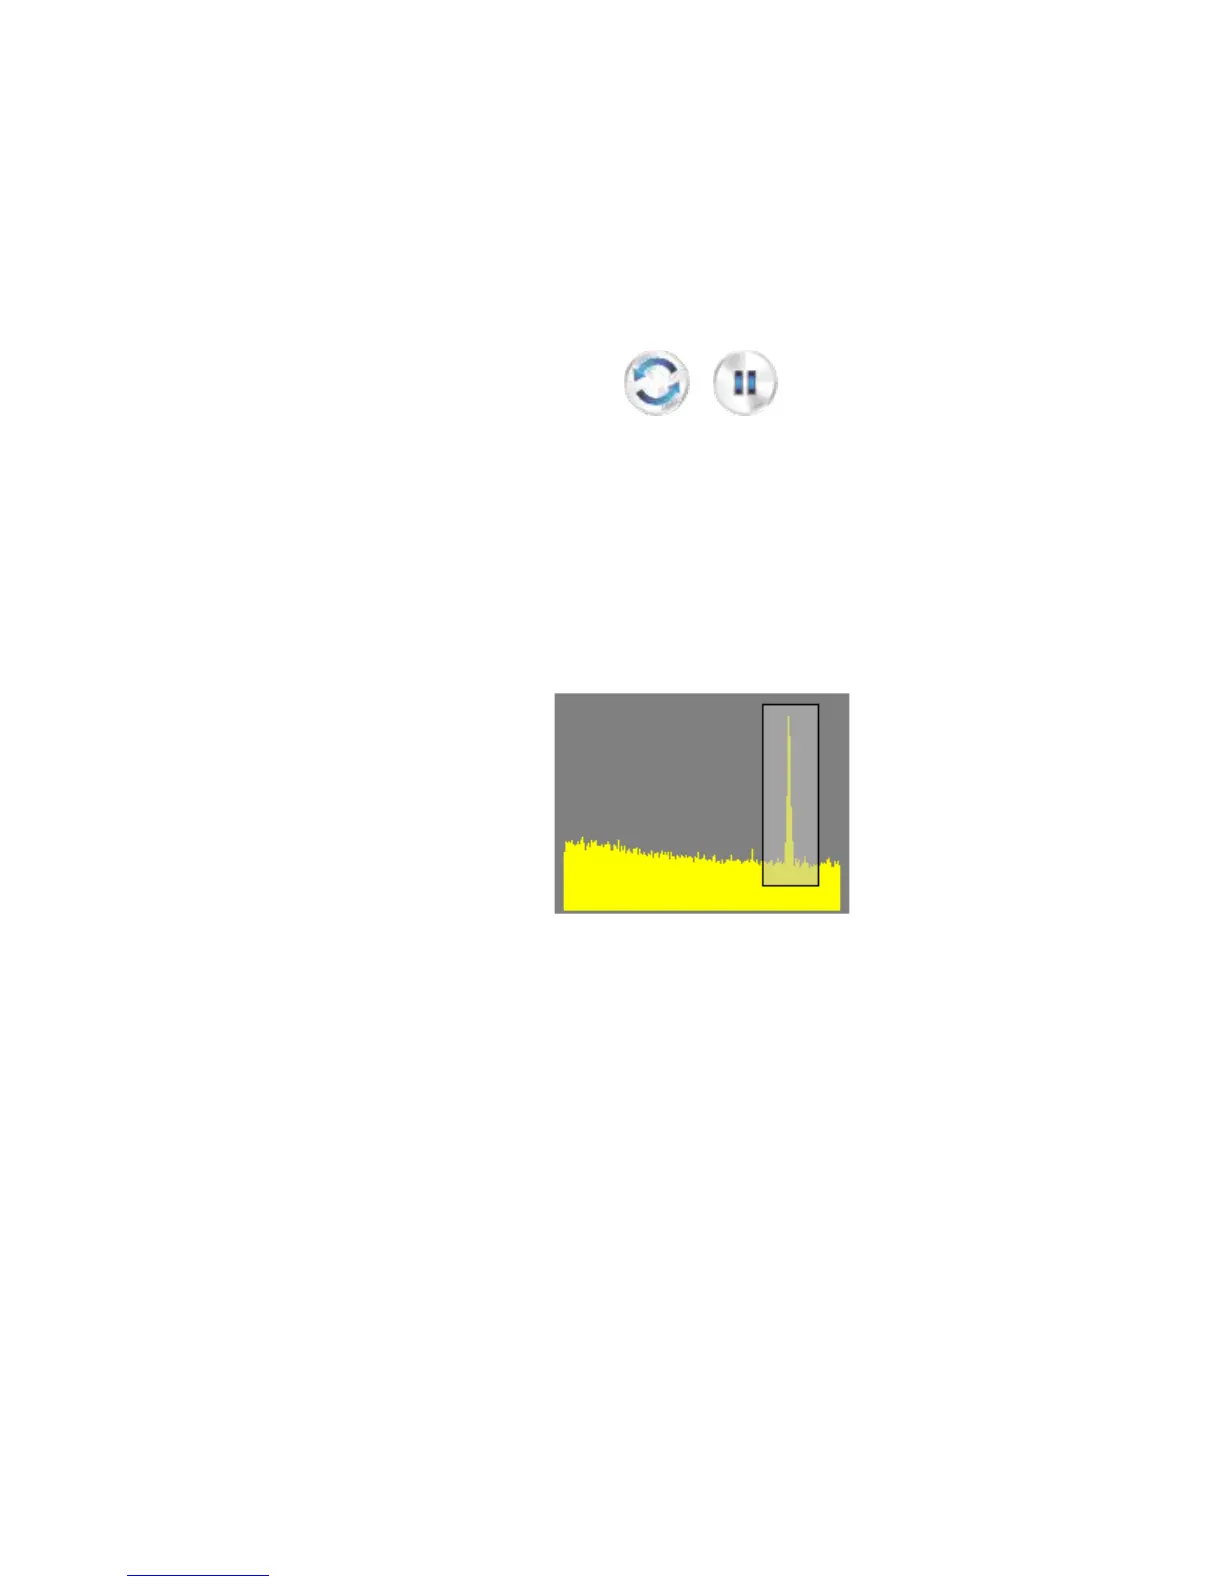
Continuous Scan
Selecting the Continuous Scan button (left) initiates the continuous measurement
of spectral data. After the Continuous Scan button is selected, it changes its
appearance to the Pause button (right). The Spectrum Display and Markers
Table are updated continuously until the Pause button is selected. Selecting the
Pause button stops data collection and the Spectrum Display and Markers Table
display the last measured data. The Optical Channels Table continuously
updates when the NuView Display Software is connected to the 428 system.
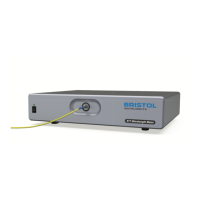
Spectrum Thumbnail
This is a small representation of the entire measured spectrum. When the
Spectrum Display shows only a portion of the measured spectrum (see Display
Zoom function), the thumbnail highlights the displayed spectrum with a box. The
highlighted box can be dragged (left-click and hold) to the spectral feature of
interest.
If the thumbnail hides a spectral feature of interest in the Spectrum Display, it can
be disabled by un-selecting Show Spectrum Thumbnail in the View menu.
Figure 4.3: Spectrum Thumbnail
Display Zoom
The displayed spectrum can be magnified to focus on a portion of the measured
spectrum. Left-clicking and dragging the mouse on the Spectrum Display causes
the appearance of a rectangle with “rubber band” behavior. By enclosing the
portion of the spectrum of interest with the “rubber band” rectangle and releasing
the left-click, the Spectrum Display will zoom in (horizontally and vertically) on the
selected portion of the spectrum.