Installation and Connections
SM-DIN/MULTILOOP.. - 2.27 -
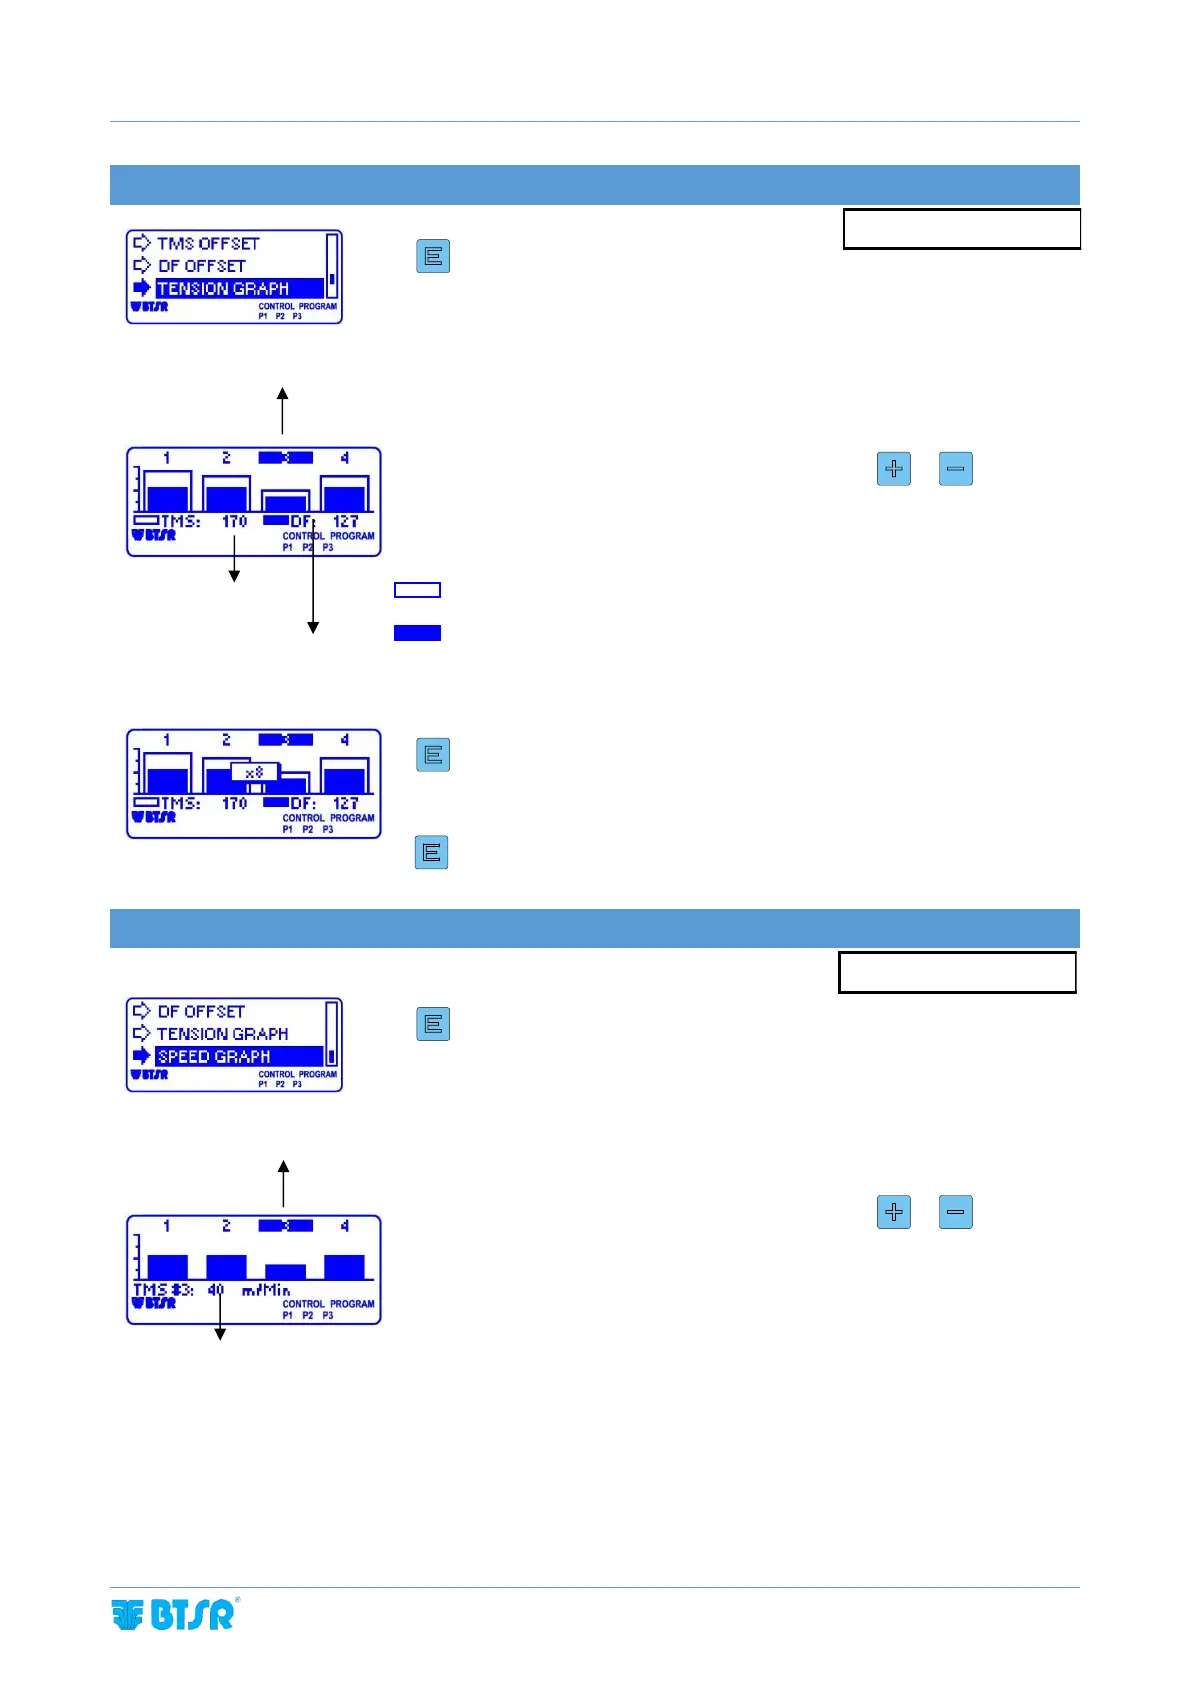
TENSION GRAPH DISPLAY
Enter the TENSION GRAPH menu.
The graph bar displayed shows the trend of the tension detected on TMS sensors
and Diaper Feeder devices.
The upper part of the screen shows the numbers of the positions connected (4 on
this example). To move from a position to the other, press or .
The lower side of the screen shows the real time values of the tension measured by
the devices of the highlighted position (the third one on this example).
The TMS sensor graph is a white rectangle with blue profile.
The Diaper Feeder device graph is a blue rectangle.
SPEED GRAPH DISPLAY
(Only if LOOP MODE = MULTILOOP)
Enter the TENSION GRAPH menu.
The graph bar displayed shows the trend of the speed detected on TMS sensors.
The upper part of the screen shows the numbers of the positions connected (4 on
this example). To move from a position to the other, press or .
The lower side of the screen shows the real time values of the speed measured by
the devices of the highlighted position (the third one on this example).
Tension value
detected by TMS
sensor n. 3
Tension value detected
by Diaper Feeder device
n.3
Displayed sensor/device number
Speed value detected
by TMS sensor n. 3