OPERATION
31
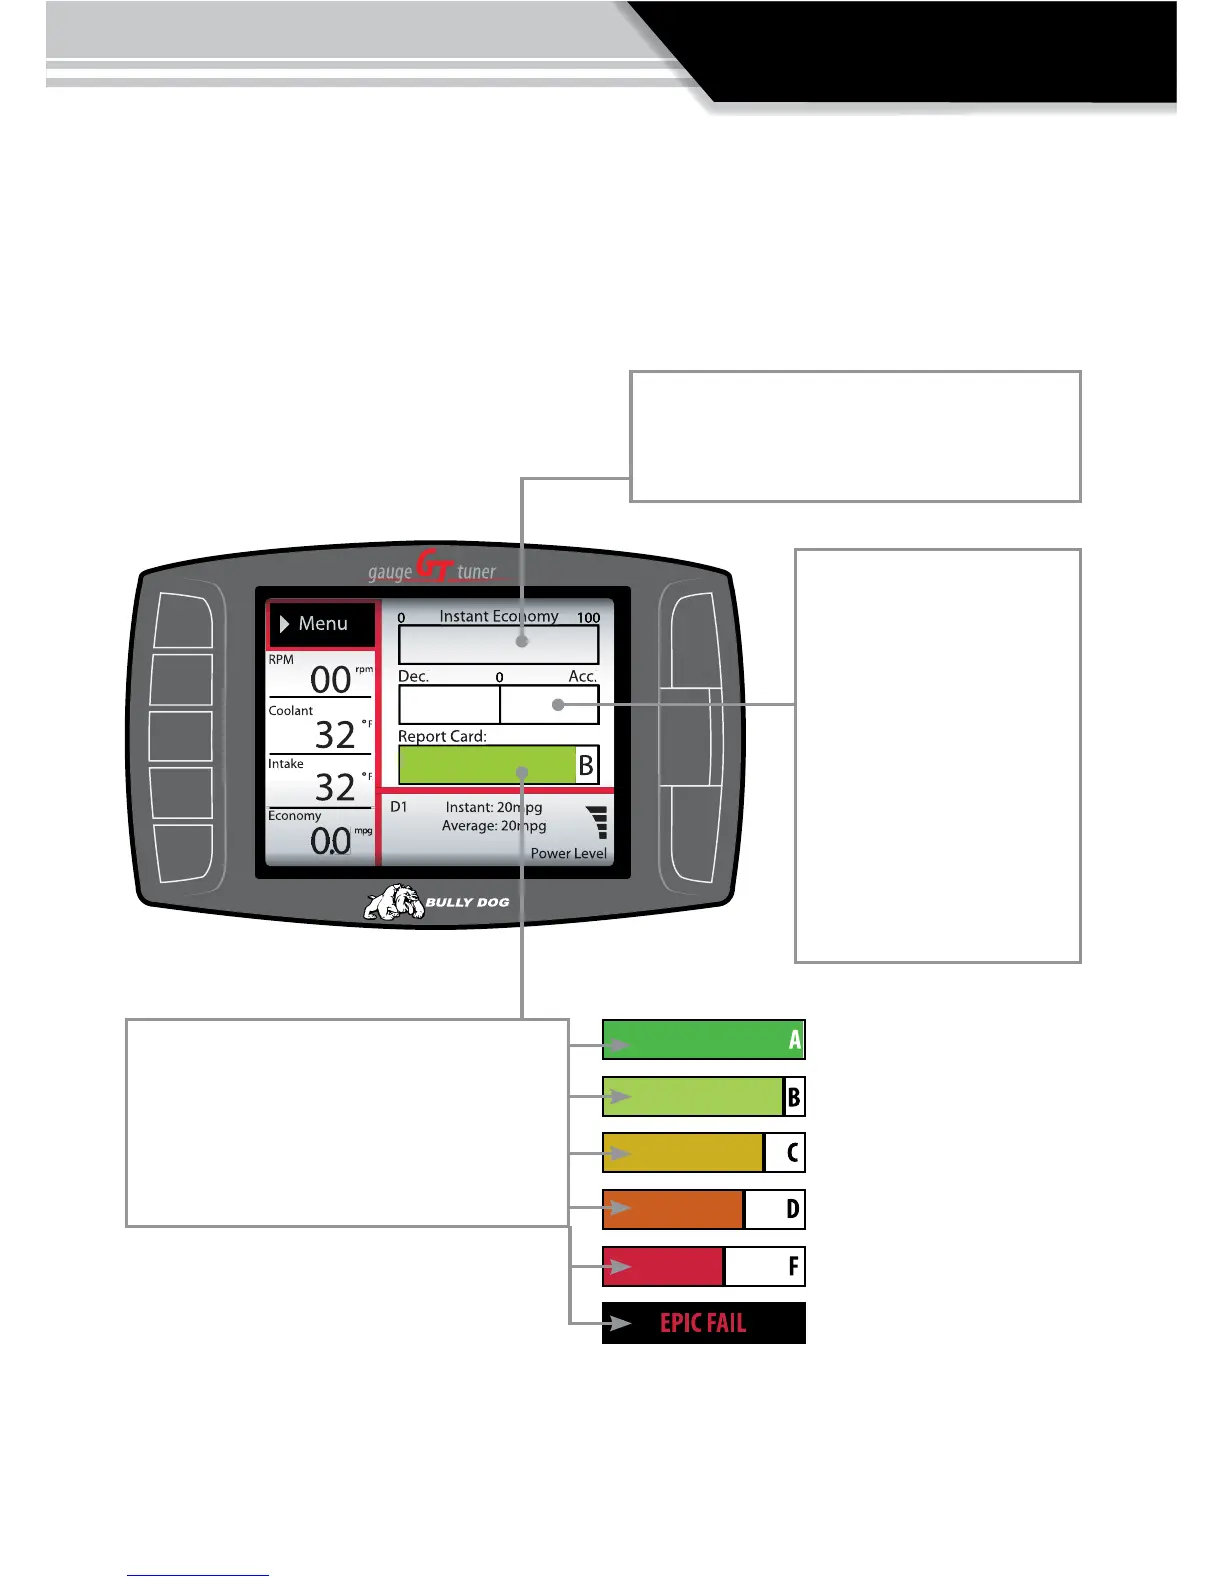
THE DRIVING COACH DISPLAY DIAGRAM
The large gauge area is where the Driving Coach information is displayed. The diagram below
illustrates the information that is collected and displayed by the Driving Coach.
®
A You are an ecient Driver
B Good
C Average
D Poor
F Fail
Epic Fail Time for a Tune up
Real Time Fuel Economy: The rst bar graph dis-
play fuel economy in gallons per hour or liters
per 100 kilometers in real time.
Wasted Energy: The waste
energy graph, middle graph,
displays acceleration and
deceleration. The center line
of this graph represents zero
wasted energy. If a driver
accelerates too quickly or
decelerates too quickly they
will see a bar extend out-
ward from zero indicating an
amount of energy wasted.
Grade: The driving Coach oers the user a grade
to show them how well or how eciently they
are driving. The Driving Coach will display one
of six possible grades. Grades are based on an
average overall driving eciency rating.