USER MANUAL
i -SERIES
i-SERIES
advancEd amplIfIERS
P. 23
20k10k1k10010
Hz
+1
+0,5
0
-0,5
-1
-1,5
-2
-2,5
-3
-3,5
-4
dBr
-60 -50 -40 -30 -20 -10 0 10
0,1
0,01
0,001
%
-60 -50 -40 -30 -20 -10 0 4
dBu
1
0,1
0,01
0,001
%
20k10k
1k
10020
0,1
0,01
0,001
%
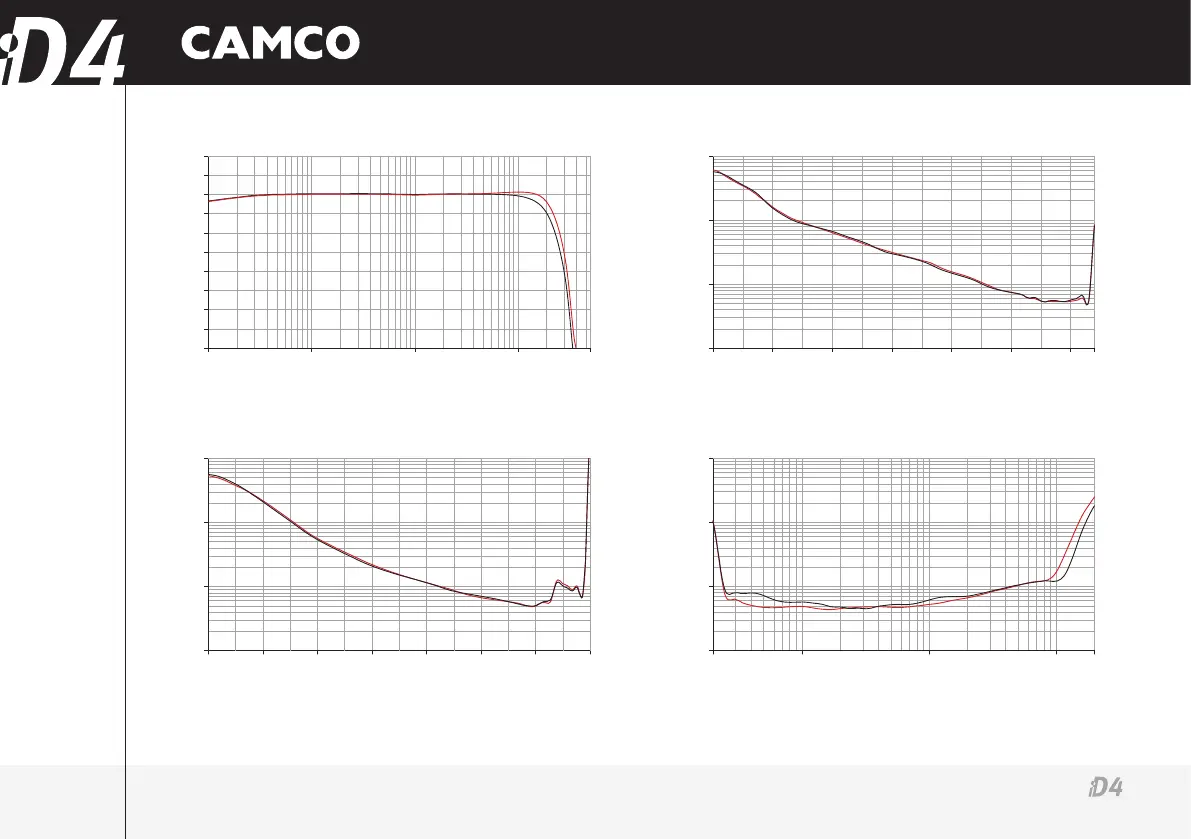
7 TYPICAL PERFORMANCE DIAGRAMS
7. Typical Performance Diagrams
Figure 7.1
Gain vs. frequency, 120 W output power
(Measurement of a typical performance @ 2 Ω & 4 Ω)
Figure 7.2
THD@1kHzvs.inputlevel@4Ωload(32dBamplifiergain)
(Measurement of a typical performance of Ch 1 & Ch 2)
Figure 7.3
THD@1kHzvs.inputlevel@2Ωload(32dBamplifiergain)
(Measurement of a typical performance of Ch 1 & Ch 2)
Figure 7.4
THD vs. frequency, 120 W output power
(Measurement of a typical performance @ 2 Ω & 4 Ω)