BT2 user manual - H-5911-9004-02-B Page | 99
The display options of each layer can be changed in the Layers tab. Select a colouring option from the Display
Settings drop down list. This selection overrides any colour settings for individual entities within the layer.
Restore settings for individual entities within a layer by selecting the blank entry from the Display Settings drop
down list.
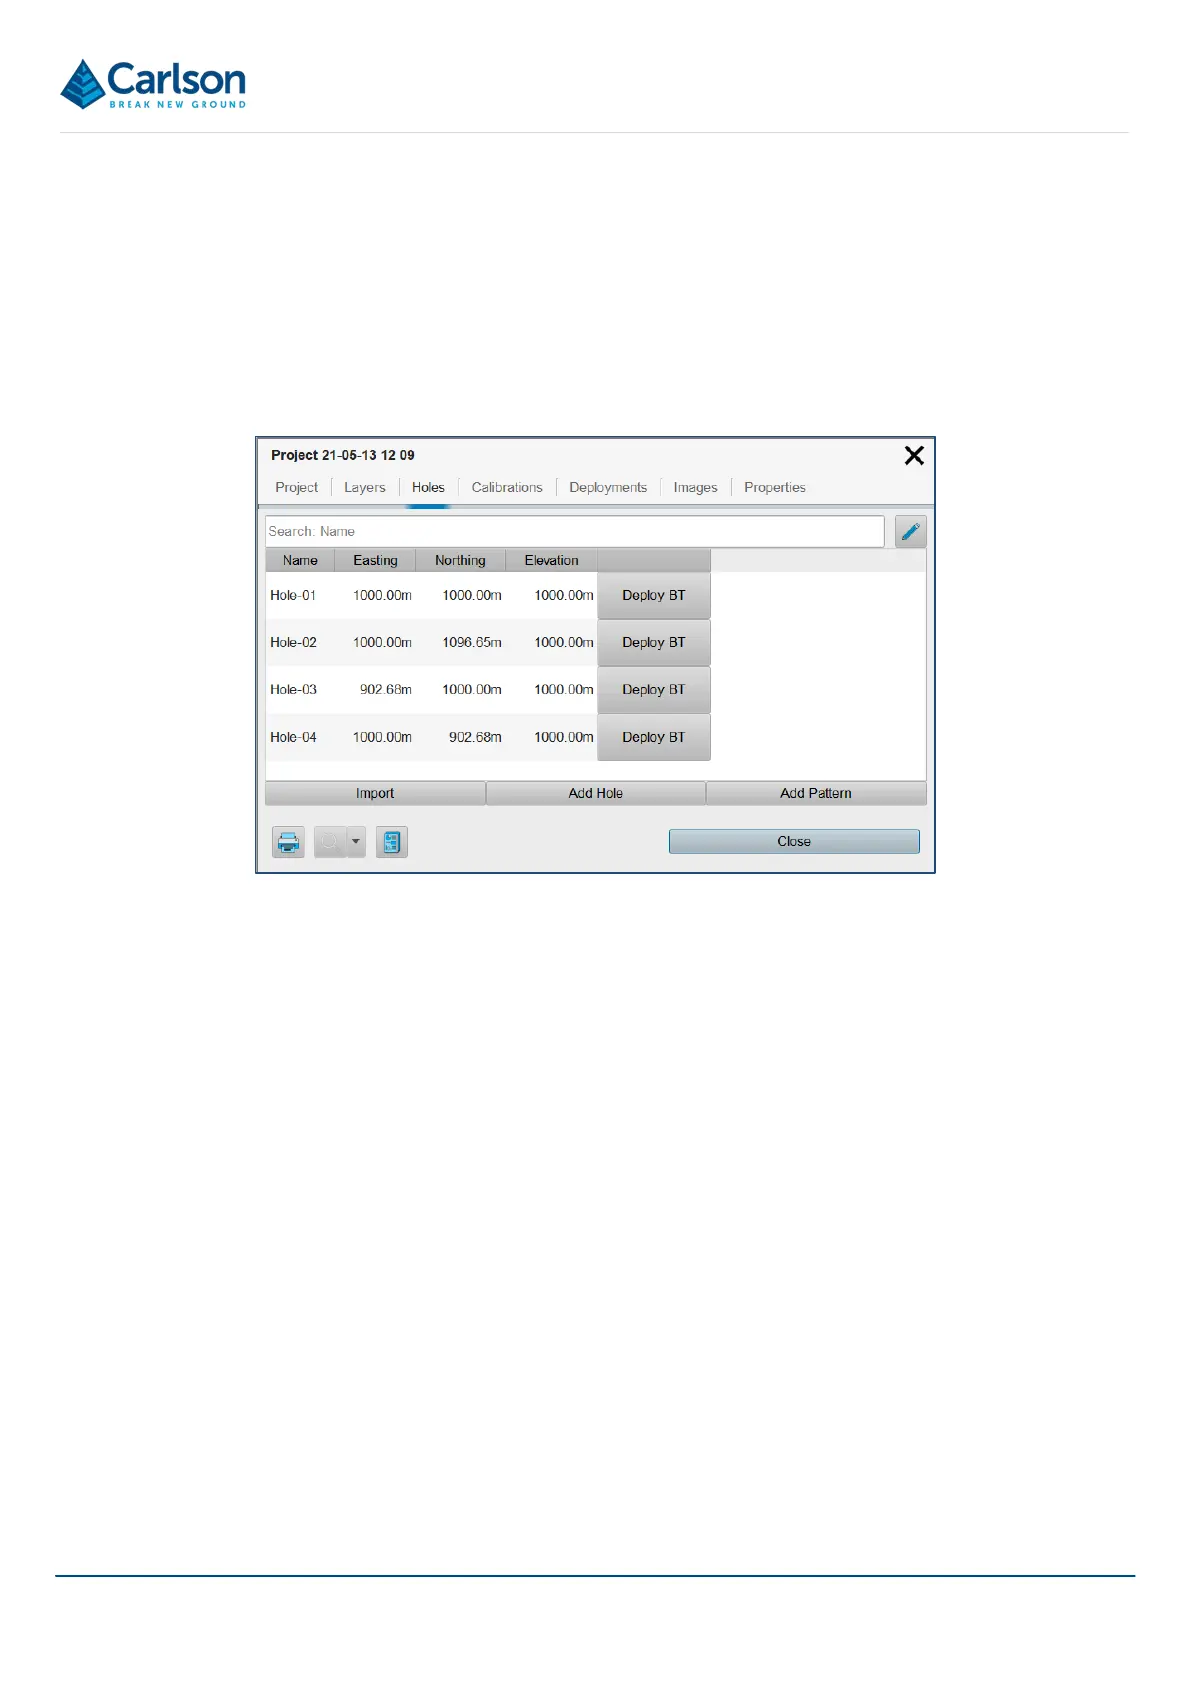
14.1.3 Holes tab
The Holes tab provides tools for managing the holes in the project.
A Hole defines the position of the hole collar. The XY coordinates should mark the point on the collar where the
probe is deployed. The Z value should mark the elevation to which each deployment interval is measured.
A list of all holes in the active project is displayed. The list shows the station name followed by the station coordinates
and a Deploy button.
To edit a hole in the list, tap on the appropriate hole to open the Hole Details window (see section 14.2.1).
To start a survey from a specific hole, tap the Deploy BT button next to the appropriate station.
In the 3D View, the location of these coordinates is marked by a hole graphic.
Tap Import to add holes from a file to the project. The file may be a Carlson *.DRL file, or a *.CSV text file. The text
file may contain hole name, row name, coordinates, hole names and reference headings. Navigate to the
appropriate location and select a file. The Hole ASCII Import Properties window opens. Define the columns in the
file and tap Import. The holes are added to the list in the Project window > Hole tab.
Tap Add Hole to manually add a single hole to the project. The Hole Details window appears (see section 14.2.1).
Enter the hole parameters as required.
Tap Add Pattern to add a pattern of holes to the project.
14.1.4 Deployments tab
The Deployments tab lists the Boretrak2 deployments which have been carried out in the active project.
Figure 105 Project Details > Holes