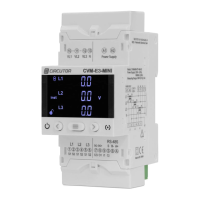
On the display screens the lower area disappears after 3 seconds without pressing any key.
It reappears by pressing the key .
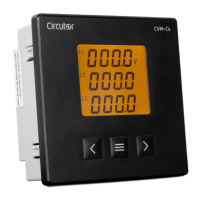
4�4�3�- CENTRAL AREA
The different display and setup menus for the device are accessed from the central area.
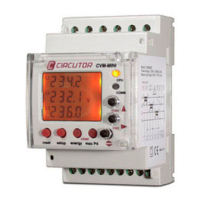
All instantaneous, incremental and demand parameters in various formats are also displayed:
Numeric representation of one, three and up to four parameters at the same time.
Analogue representation.
Graphical representation.
Representation on a bar chart.
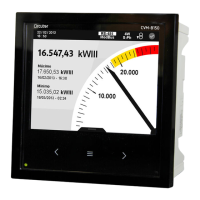
A bar chart is displayed for instantaneous and demand parameters, Figure 34, which shows the
current instantaneous value, maximum and minimum values and pre-alarm and alarm zones
programmed.
Figure 34: Description of the bar chart�
If an alarm has not been programmed for the parameter, the pre-alarm and alarm zones shown
in the bar chart are calculated.
Figure 35: Calculation of the bar chart�
The calculation formulas are:
Neutral-phase voltage and neutral voltage
L = Primary rated voltage* 0.9 H= Primary rated voltage * 1.1
Min = L * 0.8 Max = H * 1.2
PL = L + (( H - L) * 0.1) PH = H - (( H - L) * 0.1)
50
CVM-A1000 - CVM-A1500
Instruction Manual