Technical Manual Page 4 CODEL
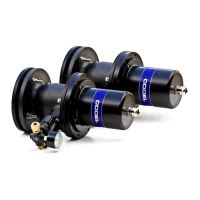
Using the correlation function R
BA
() to operate on these two signals the following correlogram is obtained.
NOTE: with = 0 (i.e. no delay on signal A(t)) then R
BA
() = 0, and when A(t) has been delayed by six time-
intervals R
BA
() is a maximum. The six time-intervals is the delay between the two signals.
Both signals are sampled and digitised at fixed time delay intervals. The correlation function of R
BA
() is then
computed for a fixed number of time delay intervals to derive the correlogram. For example, if the set of data
above where each signal a(t) and b(t) each comprise a square pulse resulting in a triangular shaped
correlogram, just twelve time delay intervals are shown. The instrument always computes the correlation
function for 256 time delays intervals. The time delay interval used can be selected and is defined as the DATA
RATE. This is, in effect, the resolution of the time delay measurement. It is normally set to 1msec.
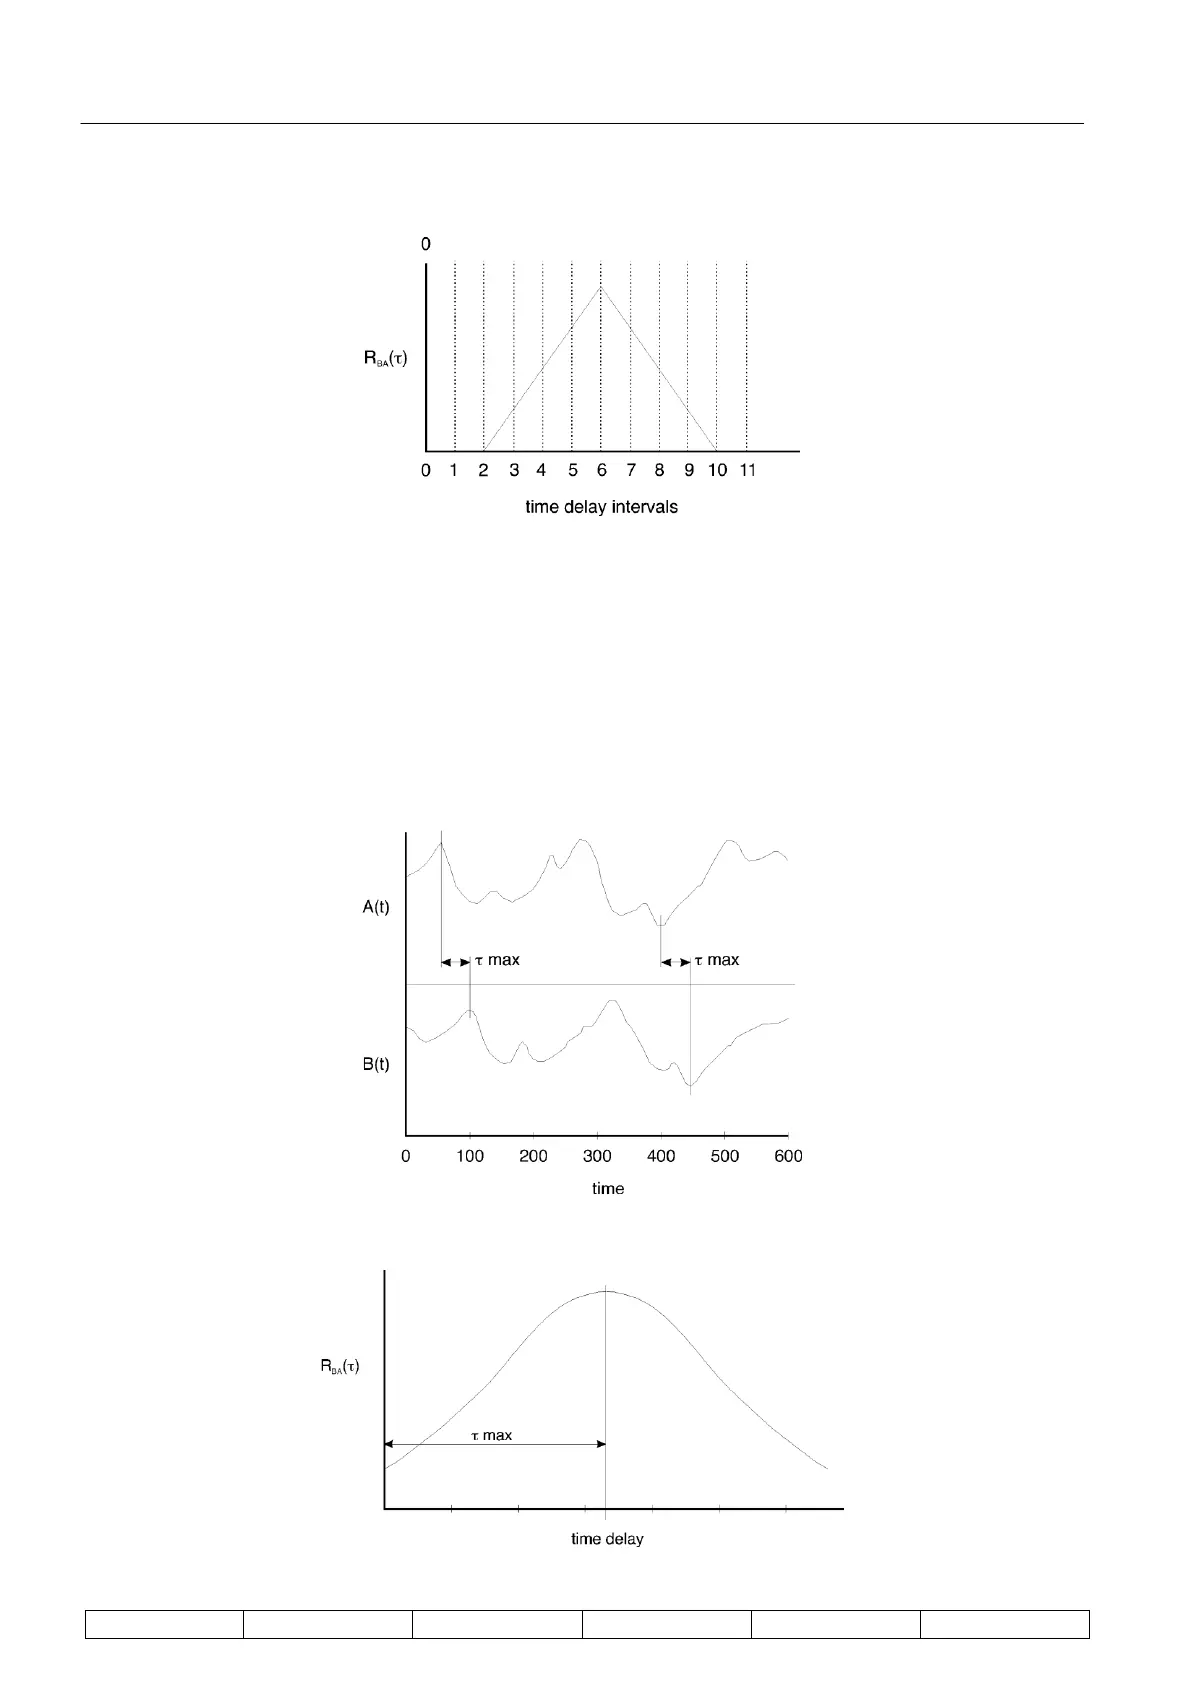
Now consider two actual signals from the transducers as shown below :
Using the correlation function R
BA
() to operate on the above two signals a typical correlogram as shown below
is obtained.